Field Notes
<--2006-11-04 09:00:00 |
2006-11-29 00:00:00-->
Phenocam link:
Searching...Tonzi: 2006-11-19 11:00:00 (DOY 323)
Author: Siyan Ma
Others:
When: Date: 11/19/2006 , Day: 323 ,
Watch Time: 11:00am .
Where: Tonzi/Vaira Ranch
Who: Siyan
Weather:
clear, a few white, light clouds, very foggy on Hwy 4
Phenology:
grass germination, 2-3cm tall in Varia, 0-2cm tall in Tonzi. Oak leaves have
fallen off.
Summary
- swap new Li-7500 set (SN
0976) on Tower,
- check and download data at
Tower, Floor, and Varia. EC systems
worked well. Power looks OK in
three sites.
- No picture taken on Tower after Nov. 4. I corrected PC clock and datalogger clock
with GPS at tower and floor sites on Nov. 4. Tower PC is about 3 minute ahead
compared with Floor PC. I am not
sure I did something wrong. Tower
picture is taken again after I corrected PC clock today.
- grass sample for LAI and
phenology in Vaira
- Measured soil moisture, dendrometer,
and spectrometer. Dendrometers need
reset because some have been out of range!!!
Vaira_Grass
Site
- Fence and gate power: >12 v.
- Panel and Batteries: 13.7 v; 15.8 amps; 2.5 amps.
- Reading from Gillsonic screen
before downloading data. (The value
of H2O and CO2 should be in the range of 0 – 5 v.)
Time
|
11:51:27
|
Path/File name
|
D:\Data\V06_ 323
.flx
D:\Data\VR06 3231130 .raw
|
|
mean
|
std
|
|
mean
|
std
|
w
|
0.27
|
0.3
|
Ts
|
17.3
|
0.475
|
u
|
0.05
|
0.32
|
H2O
|
2.907
|
0.023
|
v
|
-0.03
|
0.663
|
CO2
|
2.56
|
0.01
|
|
|
|
TC
|
1.65
|
0.029
|
- downloading data OK
- check the fans of air temp.
and relative humidity sensors at Vaira. OK
- Check MD-9 system connections
OK
- Check levels of Radiation
sensors, clear up surfaces. OK
9. Closed gate and
set up fence. OK
Tonzi_Tower Site
- Fence and gate power: >12 v.
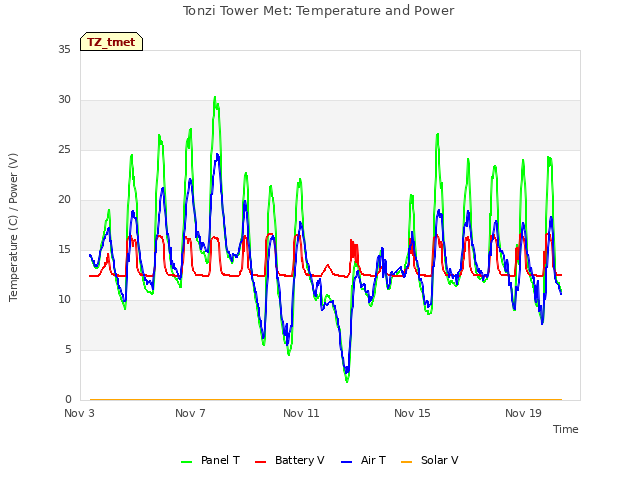
- Panel and Batteries: 13.3 v; 0.0 amps; 5.0 amps.
- Reading from Gillsonic screen
before downloading data. (The value
of H2O and CO2 should be in the range of 0 – 5 v.)
Time
|
13:10:35
|
Path/File name
|
D:\Data\T06_
323 .flx
D:\Data\TW063231200 .raw
|
|
mean
|
std
|
|
mean
|
std
|
w
|
0.05
|
0.036
|
Ts
|
19.8
|
0.512
|
u
|
3.04
|
0.686
|
H2O
|
2.98
|
0.024
|
v
|
0.08
|
0.509
|
CO2
|
2.36
|
0.023
|
- downloading data OK
- swaping Li-7500
Analyzer. (Remove SN# 41 ; install SN# 0976 )
- check the fans of air temp.
and relative humidity sensors on the tower and the floor.
- Check calibration cylinders;
CO 2 1700 psig; flow 18
psi.
N 2 1650
psig; flow 20 psi.
Manually calibrate Li-800. Following Ted’s instruction: H:\IoneSavanna_2004\Tower_2004\CO2Profile\LI800_Calibration_Procedure_2Nov04.txt
Is the pump running OK
- close gate and set up fence. OK
Toniz_Floor
Site
- Fence and gate power: >12 v.
- Panel and Batteries: 13.0 v; 4.7 amps; 1.8 amps.
- Reading from Gillsonic screen
before downloading data. (The value
of H2O and CO2 should be in the range of 0 – 5 v.)
Time
|
14:07:39
|
Path/File name
|
D:\Data\F06_ 323 .flx
D:\Data\FL06
3231400 .raw
|
|
mean
|
std
|
|
mean
|
std
|
w
|
-1.90
|
0.223
|
Ts
|
19.5
|
0.65
|
u
|
0.33
|
0.684
|
H2O
|
3.102
|
0.042
|
v
|
0.38
|
0.86
|
CO2
|
2.198
|
0.042
|
- downloading data
- Check MD-9 system connections
OK
CR23X3 – floor-Met
CR23X5 – soil CO 2
profile
CR23X6 – tower-Met
CR10X2 – floor-Met
CR10X4 – sap-flow
CR10X7 – CO 2 profile
CR10X8 – wind profile
- Soil CO2 profile
Reading
from datalogger
Panel
temp
|
23.5
|
|
|
Battery
voltage
|
13.29
|
|
|
CO2E_1
|
573
|
TCE_1
|
19.2
|
CO2W_1
|
577
|
TCW_1
|
23.5
|
CO2E_2
|
546
|
TCE_2
|
19.9
|
CO2W_2
|
683
|
TCW_2
|
20.5
|
CO2E_3
|
943
|
TCE_3
|
16.5
|
CO2W_3
|
999
|
TCW_3
|
18.2
|
CO2E_4
|
1154
|
TCE_4
|
14.7
|
CO2W_4
|
2287
|
TCW_4
|
18.6
|
Reading
from panels of analyzers
depth
|
Open
|
order
|
depth
|
Tree
|
order
|
2cm
(1%)
|
1170
|
1
|
2cm
(1%)
|
|
1
|
4cm
|
1230
|
2
|
4cm
|
|
4
|
8cm
|
1910
|
3
|
8cm
|
|
2
|
16cm
|
2300
|
4
|
16cm
|
|
3
|
- Close gate and set up fence.
tonzi
|
7931AFE
|
402165
|
574B4B
|
402FF3
|
574632
|
7A432E
|
7A3C6E
|
7A3B40
|
7A4AAA
|
19-Nov-06
|
323
|
|
|
|
|
|
|
|
|
|
SM
|
|
|
|
|
|
|
|
|
0-15
|
11.4
|
11.8
|
24.9
|
12.1
|
6.5
|
14.7
|
14.7
|
13.6
|
7.0
|
15-30
|
21.8
|
17.5
|
22.8
|
15.2
|
14.2
|
10.9
|
19.3
|
15.7
|
5.3
|
30-45
|
19.6
|
7.6
|
3.4
|
13.4
|
3.4
|
9.8
|
19.2
|
16.9
|
14.0
|
45-60
|
11.1
|
4.6
|
4.6
|
10.8
|
13.6
|
11.3
|
15.4
|
19.2
|
11.0
|
|
|
|
|
|
|
|
|
|
|
|
A6D882B
|
A3D04E8
|
A6D72F5
|
|
|
|
|
|
|
|
|
|
|
|
|
|
|
|
|
0-15
|
23.7
|
21.2
|
8.5
|
|
|
|
|
|
|
15-30
|
7.7
|
13.3
|
14.9
|
|
|
|
|
|
|
30-45
|
15.9
|
17.6
|
13.6
|
|
|
|
|
|
|
45-60
|
15.2
|
10.1
|
3.2
|
|
|
|
|
|
|
|
|
|
|
|
|
|
|
|
|
vaira
|
57318a
|
7933dee
|
|
|
|
|
|
|
|
0-15
|
5.6
|
10.9
|
|
|
|
|
|
|
|
15-30
|
13.6
|
16.7
|
|
|
|
|
|
|
|
30-45
|
12.5
|
14.4
|
|
|
|
|
|
|
|
45-60
|
20.1
|
18.8
|
|
|
|
|
|
|
|
Tonzi
|
|
|
|
Dendrometer
|
|
|
|
|
|
|
Date
|
Day
|
Tag #
|
Reading (cm)
|
11/19/2006
|
323
|
71
|
22.7
|
|
|
72
|
23.4
|
|
|
77
|
Broken
|
|
|
78
|
Broken
|
|
|
79
|
23.2
|
|
|
245
|
22.5
|
|
|
248
|
24.9
|
|
|
250
|
21.9
|
|
|
255
|
21.7
|
|
|
252
|
missing
|
|
|
102
|
Broken
|
|
Field Data
No tank data
No TZ Well data found
No TZ Moisture Point data found
No VR Moisture Point data found
No TZ grass heigth found
No VR grass heigth found
No TZ Tree DBH found
No water potential data found
No TZ Grass Biomass data found
No TZ OakLeaves Biomass data found
No TZ PineNeedles Biomass data found
0 photos found
16 sets found
No data found for TZ_Fenergy.
11 TZ_tmet graphs found


No data found for TZ_soilco2.
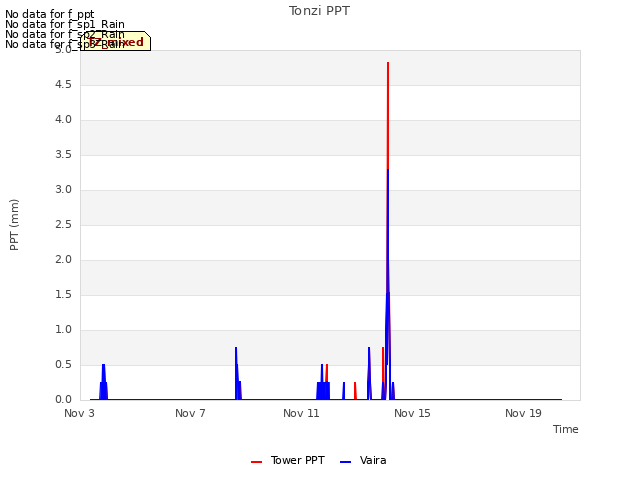
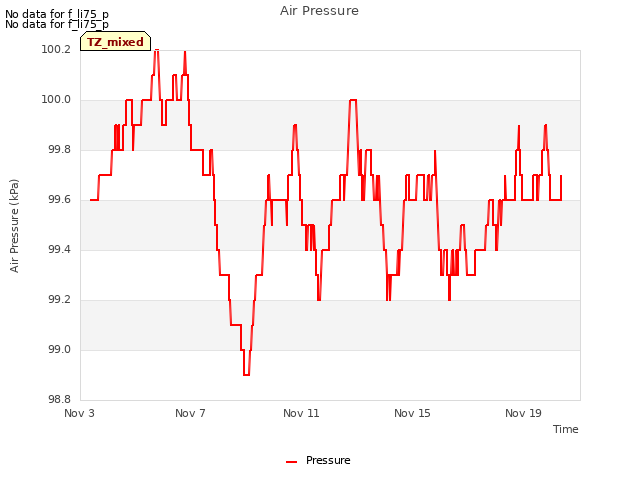
Can't check TZ_mixed
3 TZ_mixed graphs found

No data found for TZ_fflux.
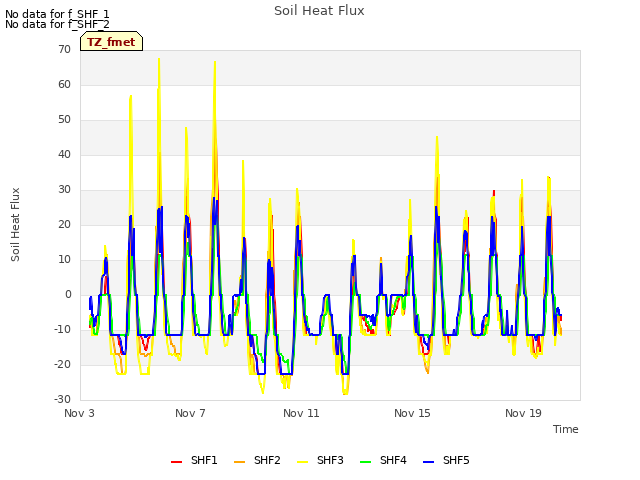
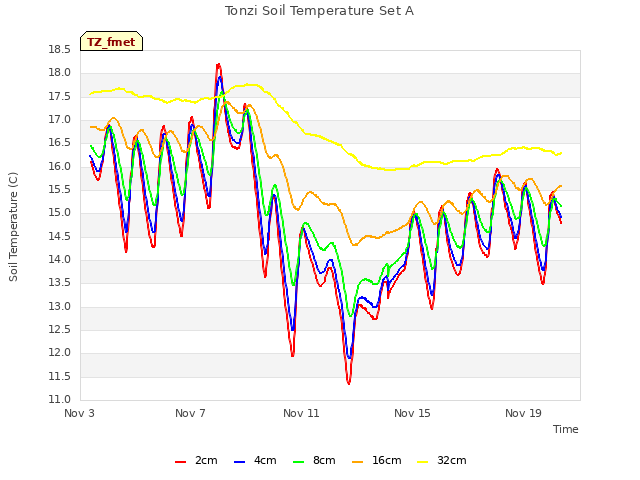
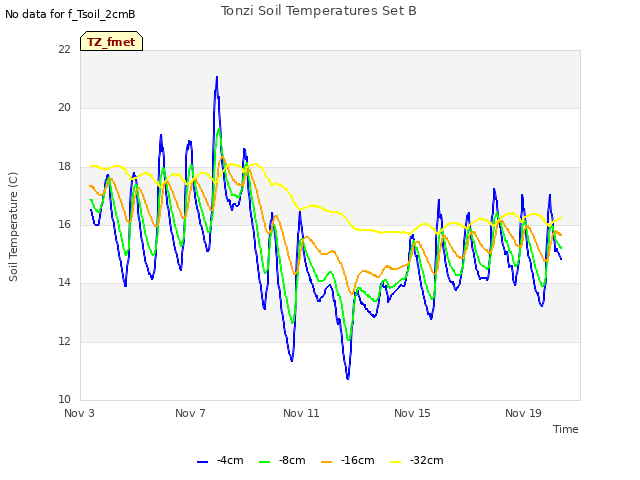
8 TZ_fmet graphs found


No data found for TZ_tram.
No data found for TZ_co2prof.
No data found for TZ_irt.
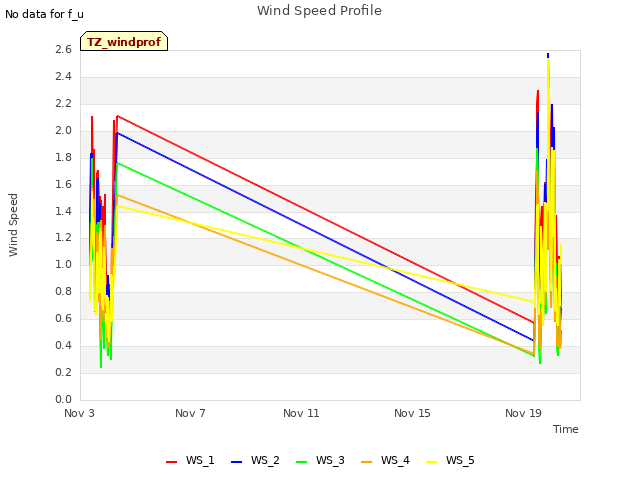
1 TZ_windprof graphs found
No data found for TZ_tflux.
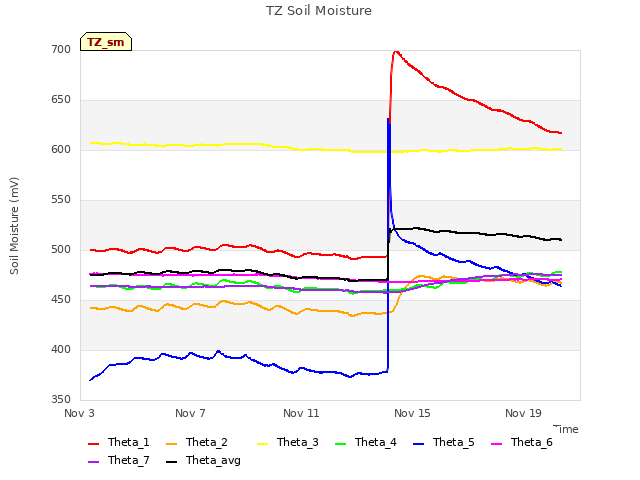
2 TZ_sm graphs found

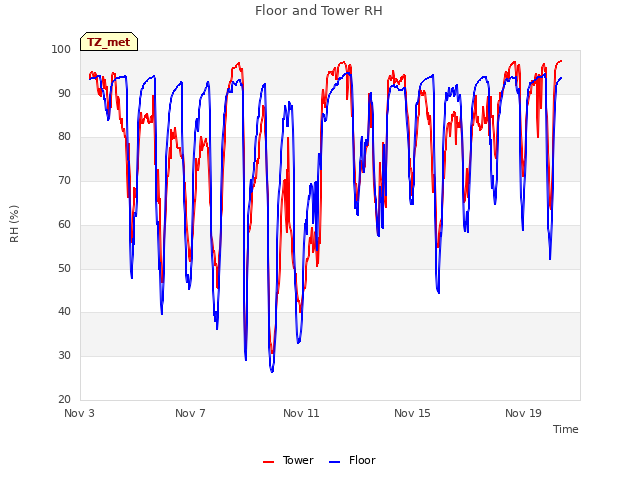
Can't check TZ_met
1 TZ_met graphs found
Can't check TZVR_mixed
No data found for TZ_osu.
No data found for TZ_fd.
Tonzi Z-cam data


