Field Notes
<--2006-10-28 00:00:00 |
2006-11-19 11:00:00-->
Phenocam link:
Searching...Tonzi: 2006-11-04 09:00:00 (DOY 308)
Author: Siyan Ma
Others:
When: Date: 11/4/2006 , Day: 308
, Watch Time: 9:00am .
Where: Tonzi/Vaira Ranch
Who: Siyan
Weather:
clear, not too hot
Phenology:
wet floor surface, no germination yet, tree leaves falling off, maybe 10% still
on with some brown color dots. Met Mr.
Tonzi.
Summary
- EC systems worked well. Data
were downloaded, including all missing download data before.
- Li-7500 at Vaira and Floor were swapped. I was planning to swap IRGA (SN 0976) at
the tower too, but CO2 channel kept giving me 0.0001. So, I swapped back to the old one, and I
am going to swap it in two weeks.
- performed spectrometer.
- collected branch and leaf sample for N analysis.
- MIBA samples were collected this time (No. 193-197).
- measured dendrometer
- measured soil moisture
- Gave a tour to Andrew Oliphant’s students
in Boundary Layer Class (Department
of Geography, San Francisco State University, 1600
Holloway Avenue, San
Francisco CA 94132, Ph: (415)
405-2143, Fax: (415) 338-6243)
Vaira_Grass
Site
- Fence and gate power: >12 v.
- Panel and Batteries: 13.5 v; 16.5 amps; 1.9
amps.
- Reading from Gillsonic screen
before downloading data. (The value
of H2O and CO2 should be in the range of 0 – 5 v.)
Time
|
9:39:08
|
Path/File name
|
D:\Data\V06_308 .flx
D:\Data\VR06 2510900 .raw
|
|
mean
|
std
|
|
mean
|
std
|
w
|
-0.06
|
0.198
|
Ts
|
17.21
|
0.386
|
u
|
-1.28
|
0.592
|
H2O
|
3.79
|
0.078
|
v
|
1.34
|
0.338
|
CO2
|
2.08
|
0.013
|
- downloading data (D212,
D301-307)
- swaping Li-7500
Analyzer. (Remove SN# 35 ; install SN# 93 )
- check the fans of air temp.
and relative humidity sensors at Vaira.
Good.
- Check MD-9 system
connections: successful!
- Check CR23X with two
multiplexers
Sys_vot = BUSY WITH COM
PC_start = didn’t find it.
- Check levels of Radiation sensors,
clear up surfaces. Yes.
9. Closed gate and
set up fence.
Tonzi_Tower Site
- Fence and gate power: >12 v.
- Panel and Batteries: - v; -
amps; - amps.
- Reading from Gillsonic screen
before downloading data. (The value
of H2O and CO2 should be in the range of 0 – 5 v.)
Time
|
12:54:39
|
Path/File name
|
D:\Data\T06_ 308
D:\Data\TW06 3081230 .raw
|
|
mean
|
std
|
|
mean
|
std
|
w
|
0.33
|
0.499
|
Ts
|
21.82
|
0.48
|
u
|
2.31
|
0.937
|
H2O
|
2.65
|
0.023
|
v
|
0.26
|
0.747
|
CO2
|
2.052
|
0.013
|
- downloading data
- swaping Li-7500
Analyzer. (Remove SN# -
; install SN# -
)
- check the fans of air temp.
and relative humidity sensors on the tower and the floor. Good.
- close gate and set up fence.
Toniz_Floor
Site
- Fence and gate power: >12 v.
- Panel and Batteries: 13.0
v; 4.0 amps; 1.8 amps.
- Reading from Gillsonic screen
before downloading data. (The value
of H2O and CO2 should be in the range of 0 – 5 v.)
Time
|
12:24:01
|
Path/File name
|
D:\Data\F06_308
.flx
D:\Data\FL06 3081200 .raw
|
|
mean
|
std
|
|
mean
|
std
|
w
|
0.03
|
.213
|
Ts
|
19.72
|
.124
|
u
|
-0.02
|
.5
|
H2O
|
3.498
|
.066
|
v
|
.83
|
.486
|
CO2
|
1.368
|
.031
|
- downloading data (only Met
data from D221, memory stick was full.)
- swaping Li-7500
Analyzer. (Remove SN# 65 ; install SN# 418 )
- Check MD-9 system connections:
ALL SUCCESSFUL!!!
CR23X3 – floor-Met
CR23X5 – soil CO 2
profile
CR23X6 – tower-Met
CR10X2 – floor-Met
CR10X4 – sap-flow
CR10X7 – CO 2 profile
CR10X8 – wind profile
- Soil CO2 profile
Reading
from datalogger
Panel
temp
|
23.9
|
|
|
Battery
voltage
|
13.1
|
|
|
CO2E_1
|
1412
|
TCE_1
|
20.9
|
CO2W_1
|
536
|
TCW_1
|
21.9
|
CO2E_2
|
899
|
TCE_2
|
22.2
|
CO2W_2
|
639
|
TCW_2
|
20.3
|
CO2E_3
|
1160
|
TCE_3
|
19.3
|
CO2W_3
|
943
|
TCW_3
|
19.3
|
CO2E_4
|
959
|
TCE_4
|
17
|
CO2W_4
|
949
|
TCW_4
|
19.6
|
Reading
from panels of analyzers
depth
|
Open
|
order
|
depth
|
Tree
|
order
|
2cm
(1%)
|
2840
|
1
|
2cm
(1%)
|
1080
|
1
|
4cm
|
1820
|
2
|
4cm
|
1290
|
4
|
8cm
|
2330
|
3
|
8cm
|
0.239%
|
2
|
16cm
|
1940
|
4
|
16cm
|
1910
|
3
|
- Close gate and set up fence.
tonzi
|
7931AFE
|
402165
|
574B4B
|
402FF3
|
574632
|
7A432E
|
7A3C6E
|
7A3B40
|
7A4AAA
|
11/4/2006
|
308
|
|
|
|
|
|
|
|
|
|
SM
|
|
|
|
|
|
|
|
|
0-15
|
12.6
|
9.6
|
16.5
|
5.3
|
11.2
|
12.6
|
17.1
|
12.7
|
4.5
|
15-30
|
13.0
|
14.2
|
11.4
|
11.7
|
11.8
|
7.2
|
18.5
|
11.8
|
2.6
|
30-45
|
17.6
|
7.5
|
3.4
|
13.9
|
2.4
|
10.2
|
21.4
|
15.6
|
13.4
|
45-60
|
12.1
|
4.6
|
3.3
|
9.5
|
12.4
|
11.1
|
16.7
|
19.3
|
9.9
|
|
|
|
|
|
|
|
|
|
|
|
A6D882B
|
A3D04E8
|
A6D72F5
|
|
|
|
|
|
|
|
|
|
|
|
|
|
|
|
|
0-15
|
20.3
|
17.1
|
6.2
|
|
|
|
|
|
|
15-30
|
4.2
|
5.4
|
11.8
|
|
|
|
|
|
|
30-45
|
15.9
|
17.6
|
13.1
|
|
|
|
|
|
|
45-60
|
15.6
|
9.9
|
3.0
|
|
|
|
|
|
|
|
|
|
|
|
|
|
|
|
|
vaira
|
57318a
|
7933dee
|
|
|
|
|
|
|
|
0-15
|
6.8
|
6.2
|
|
|
|
|
|
|
|
15-30
|
7.1
|
11.5
|
|
|
|
|
|
|
|
30-45
|
12.7
|
13.6
|
|
|
|
|
|
|
|
45-60
|
16.5
|
18.8
|
|
|
|
|
|
|
|
|
|
|
|
|
|
|
|
|
|
Tonzi
|
|
|
|
Dendrometer
|
|
|
|
|
|
|
Date
|
Day
|
Tag #
|
Reading (cm)
|
11/4/2006
|
308
|
71
|
22.5
|
|
|
72
|
23.5
|
|
|
77
|
Broken
|
|
|
78
|
Broken
|
|
|
79
|
23.4
|
|
|
245
|
20.3
|
|
|
248
|
24.6
|
|
|
250
|
21.9
|
|
|
255
|
20.5
|
|
|
252
|
missing
|
|
|
102
|
Broken
|
Sample sheet for MIBA
Sample vial
|
What
|
MIBA-US-03.193
|
Leave 1
|
MIBA-US-03.194
|
Leave 2
|
MIBA-US-03. __-_
|
Grass 1
|
MIBA-US-03. -
|
Grass 2
|
MIBA-US-03. 195
|
Soil in 10 cm
|
MIBA-US-03. 196
|
Stem 1
|
MIBA-US-03. 197
|
Stem 2
|
|
Field Data
No tank data
No TZ Well data found
No TZ Moisture Point data found
No VR Moisture Point data found
No TZ grass heigth found
No VR grass heigth found
No TZ Tree DBH found
No water potential data found
No TZ Grass Biomass data found
No TZ OakLeaves Biomass data found
No TZ PineNeedles Biomass data found
0 photos found
16 sets found
No data found for TZ_Fenergy.
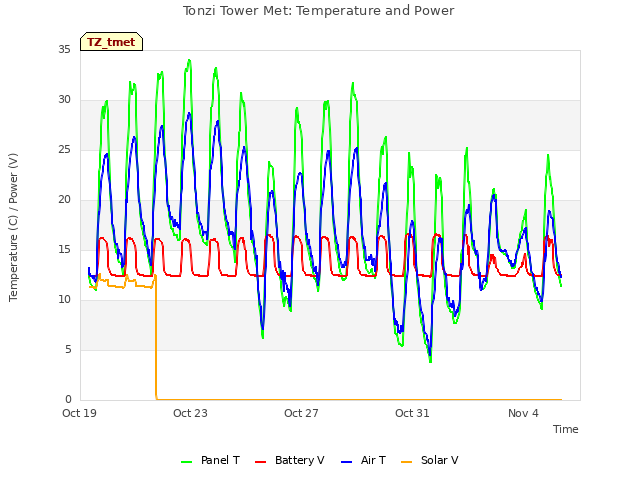
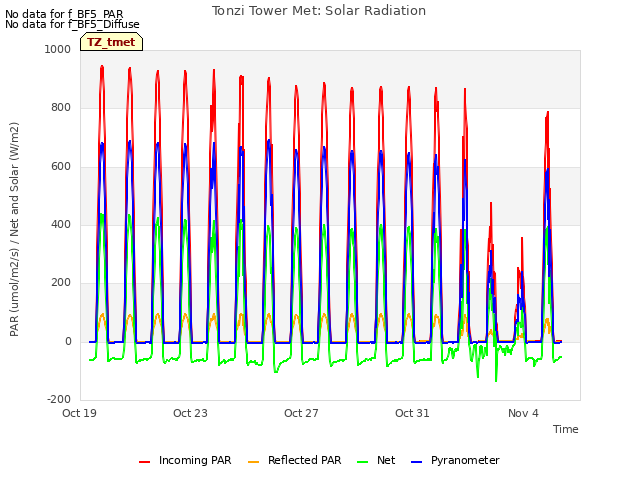
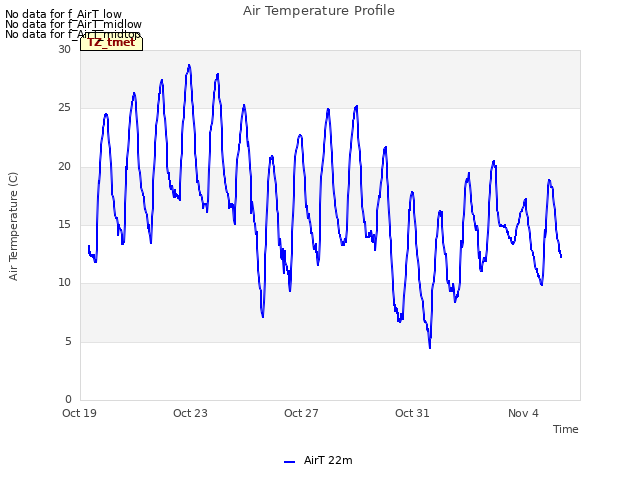
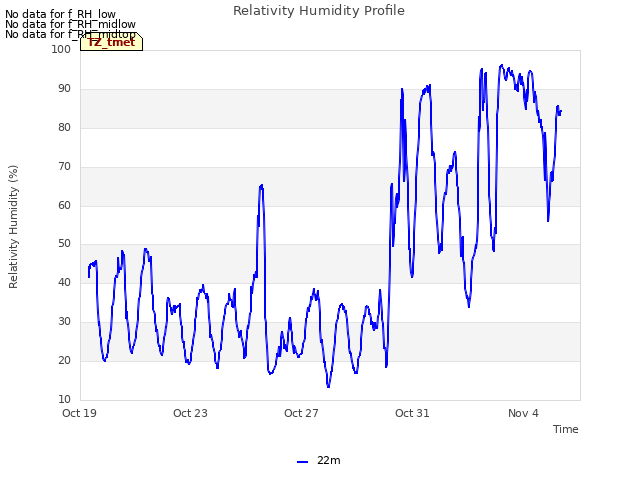
11 TZ_tmet graphs found


No data found for TZ_soilco2.
Can't check TZ_mixed
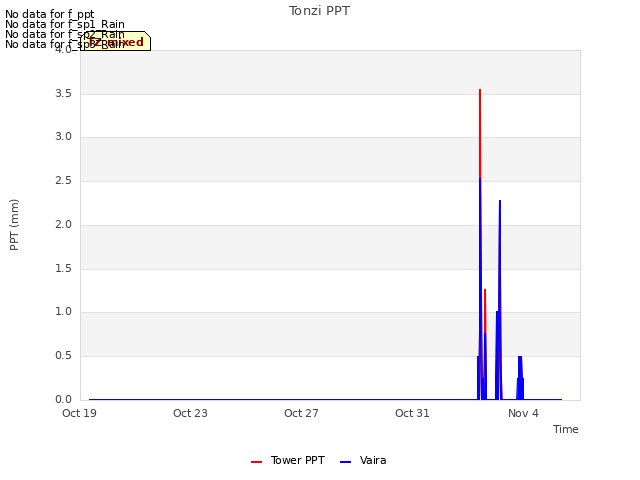
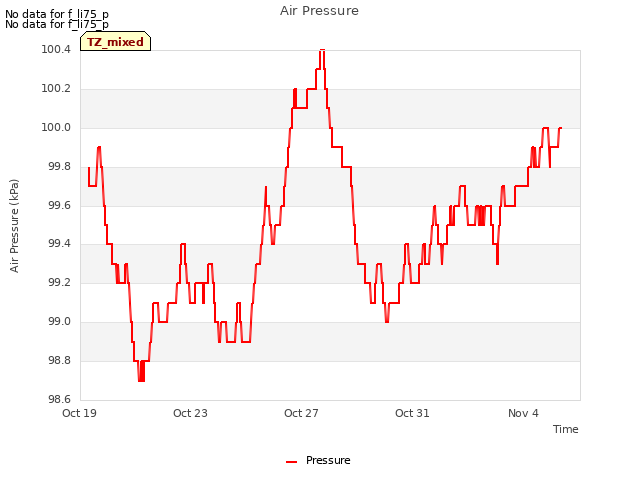
3 TZ_mixed graphs found

No data found for TZ_fflux.
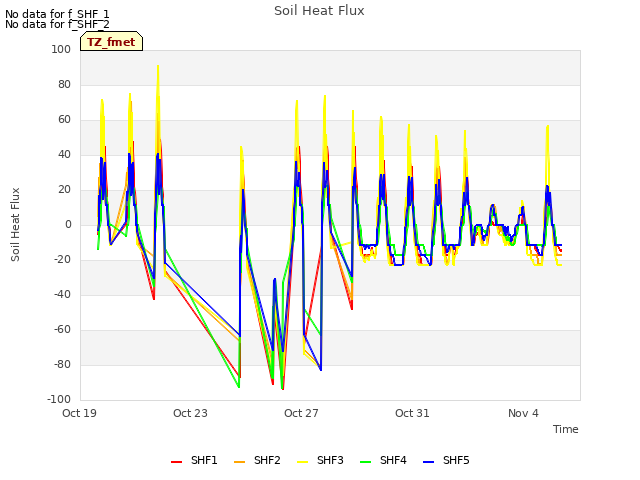
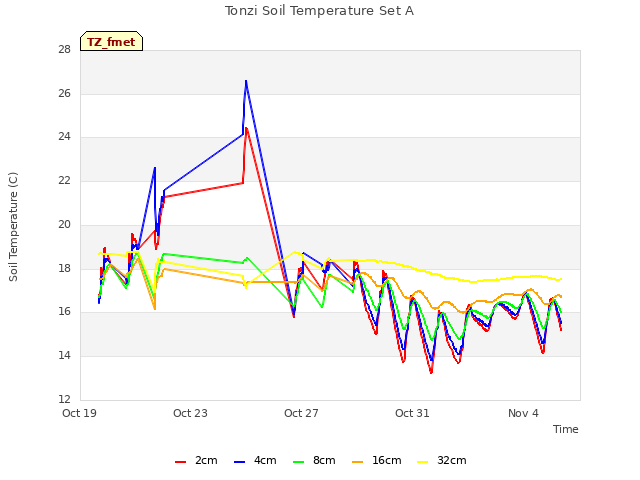
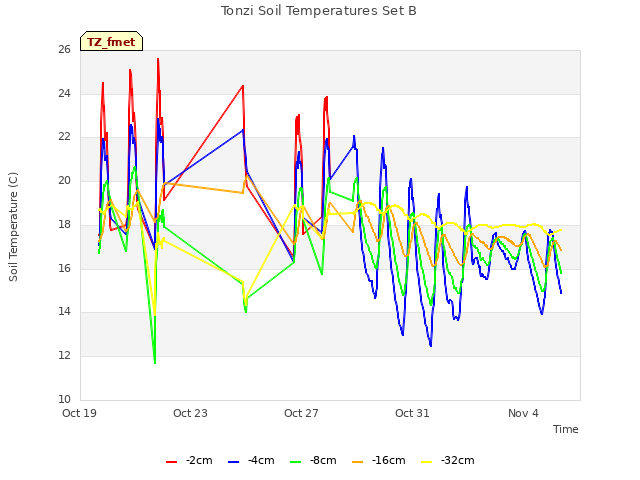
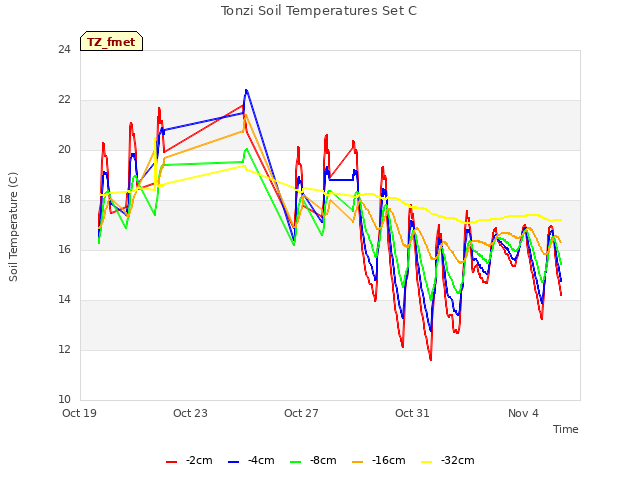
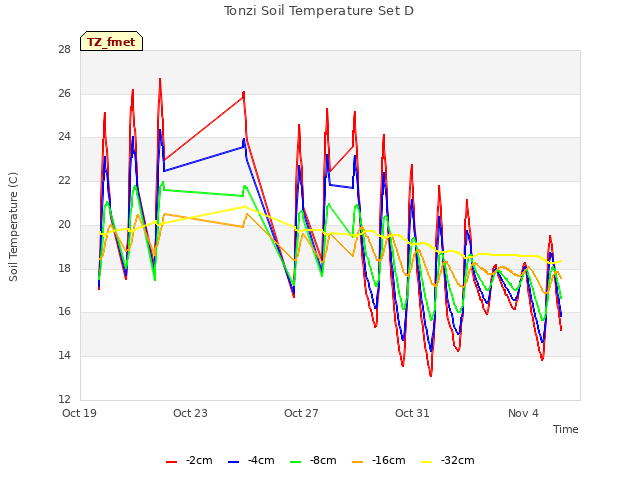
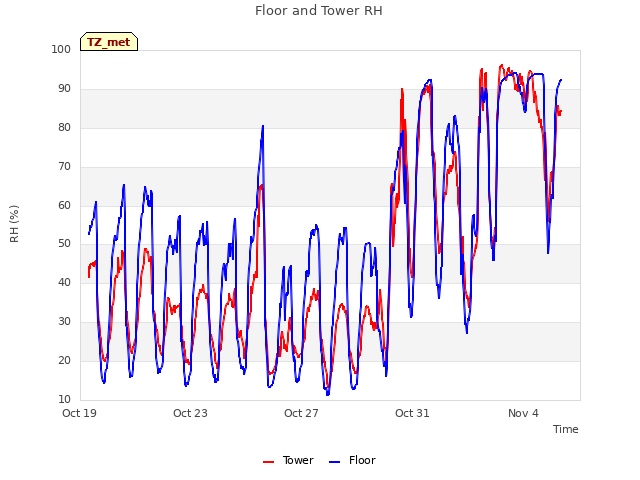
8 TZ_fmet graphs found


No data found for TZ_tram.
No data found for TZ_co2prof.
No data found for TZ_irt.
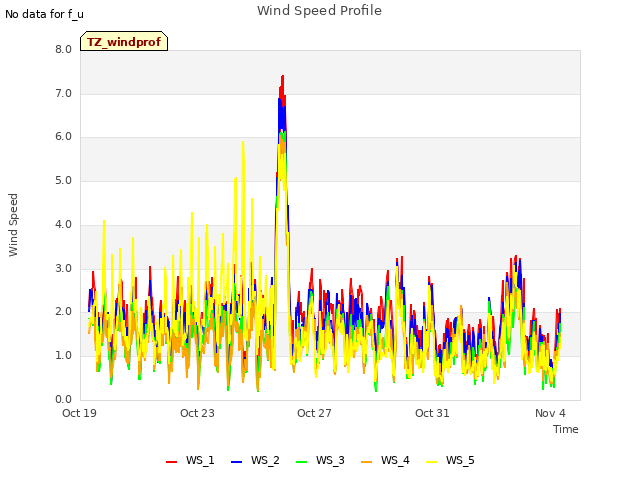
1 TZ_windprof graphs found
No data found for TZ_tflux.
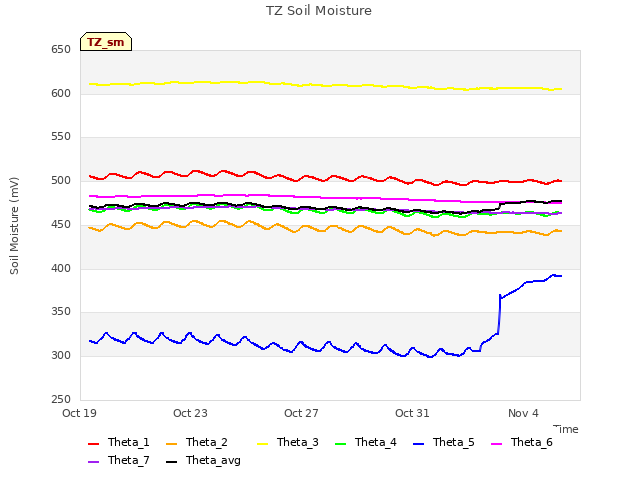
2 TZ_sm graphs found

Can't check TZ_met
1 TZ_met graphs found
Can't check TZVR_mixed
No data found for TZ_osu.
No data found for TZ_fd.
Tonzi Z-cam data


