
Field Notes
<--2018-04-25 10:30:00 | 2018-05-23 10:00:00-->Other sites visited today: Vaira
Phenocam link: Searching...
Tonzi: 2018-05-11 11:00:00 (DOY 131)
Author: Joe Verfaillie
Others: Siyan
Summary: Installed Global Water logger at Road Well, problems with new CF card for phenocam image collection, standard fieldwork, midday water potential
| Tonzi 2018-05-11 I arrived at about 11am with Siyan. It was clear, sunny and warm with a strong cool breeze from the west. Lots of flowers. The trees look fully leafed out. The ground is mostly dry. I installed the repaired Global Water well sensor sn 57278 in the well next to the road. I was planning to mount it on the well pipe, but that pipe is really short. Instead I pounded in a fence post next to the well pad and mounted the box and solar panel on the post. The sensor/data logger is running on a small SLA battery and connected with the solar panel with the cheap solar controller sn 3317052234210. This controller is overkill for this system. I may be able to get a smaller panel and just connect it to the battery, but then a low voltage cutoff would be a good idea. I collected all the data including the zcams. I tried replacing the CF card for the Stardot images with a brand new Verbatim card, but the CR1000 would not recognize the card. I ended up removing the current images from the SanDisk card and reinstalling it. Siyan did the other fieldwork and midday water potential. |
Field Data
No tank data
Well Depth
| Date | Location | Depth (feet) |
|---|---|---|
| 2018-05-11 | TZ_floor | 18.8 |
| 2018-05-11 | TZ_road | 27.9 |
| 2018-05-11 | TZ_tower | 22.9 |
mode = both
Moisture Point Probes TZ
Array
(
[0] => Tower_1
[1] => Floor_South_1
[2] => Floor_East_1
[3] => Floor_West_1
[4] => Soil_Transect_4_1
[5] => Soil_Transect_3_1
[6] => Soil_Transect_2_1
[7] => Soil_Transect_1_1
[8] => SoilCO2_West_A_1
[9] => SoilCO2_West_B_1
[10] => SoilCO2_West_C_1
[11] => Tower_2
[12] => Floor_South_2
[13] => Floor_East_2
[14] => Floor_West_2
[15] => Soil_Transect_4_2
[16] => Soil_Transect_3_2
[17] => Soil_Transect_2_2
[18] => Soil_Transect_1_2
[19] => SoilCO2_West_A_2
[20] => SoilCO2_West_B_2
[21] => SoilCO2_West_C_2
[22] => Tower_3
[23] => Floor_South_3
[24] => Floor_East_3
[25] => Floor_West_3
[26] => Soil_Transect_4_3
[27] => Soil_Transect_3_3
[28] => Soil_Transect_2_3
[29] => Soil_Transect_1_3
[30] => SoilCO2_West_A_3
[31] => SoilCO2_West_B_3
[32] => SoilCO2_West_C_3
[33] => Tower_4
[34] => Floor_South_4
[35] => Floor_East_4
[36] => Floor_West_4
[37] => Soil_Transect_4_4
[38] => Soil_Transect_3_4
[39] => Soil_Transect_2_4
[40] => Soil_Transect_1_4
[41] => SoilCO2_West_A_4
[42] => SoilCO2_West_B_4
[43] => SoilCO2_West_C_4
)
| Date | DOY | Rep | Depth | Tower_1 |
Floor_South_1 |
Floor_East_1 |
Floor_West_1 |
Soil_Transect_4_1 |
Soil_Transect_3_1 |
Soil_Transect_2_1 |
Soil_Transect_1_1 |
SoilCO2_West_A_1 |
SoilCO2_West_B_1 |
SoilCO2_West_C_1 |
Tower_2 |
Floor_South_2 |
Floor_East_2 |
Floor_West_2 |
Soil_Transect_4_2 |
Soil_Transect_3_2 |
Soil_Transect_2_2 |
Soil_Transect_1_2 |
SoilCO2_West_A_2 |
SoilCO2_West_B_2 |
SoilCO2_West_C_2 |
Tower_3 |
Floor_South_3 |
Floor_East_3 |
Floor_West_3 |
Soil_Transect_4_3 |
Soil_Transect_3_3 |
Soil_Transect_2_3 |
Soil_Transect_1_3 |
SoilCO2_West_A_3 |
SoilCO2_West_B_3 |
SoilCO2_West_C_3 |
Tower_4 |
Floor_South_4 |
Floor_East_4 |
Floor_West_4 |
Soil_Transect_4_4 |
Soil_Transect_3_4 |
Soil_Transect_2_4 |
Soil_Transect_1_4 |
SoilCO2_West_A_4 |
SoilCO2_West_B_4 |
SoilCO2_West_C_4 |
Avg | Spacial Count |
Measurement Count |
|---|---|---|---|---|---|---|---|---|---|---|---|---|---|---|---|---|---|---|---|---|---|---|---|---|---|---|---|---|---|---|---|---|---|---|---|---|---|---|---|---|---|---|---|---|---|---|---|---|---|---|
| 2018-05-11 | 131 | 0 | nan | 9.4 | 2.2 | 13.5 | 11.1 | 7.1 | 6.2 | 7.4 | 3.6 | 8.6 | 10.3 | 7.4 | 17 | 14.2 | 17 | 11.5 | 10.6 | 18.5 | 19.1 | 6.3 | 13.3 | 5.7 | 17.3 | 20.7 | 22.6 | 39.6 | 20.7 | 13.1 | 20.1 | 24.3 | 20.9 | 24 | 22.6 | 24.3 | 32.2 | 34 | 39.4 | 34.5 | 18.5 | 29.7 | 42 | 18.8 | 35.4 | 34 | 37.1 | |||
| 2018-05-11 | 131 | 1 | nan | 9.4 | 2.8 | 15 | 13.5 | 7.4 | 6.2 | 8 | 3.6 | 13 | 9.4 | 7.1 | 16.4 | 13.6 | 17.8 | 11.5 | 10.3 | 19.4 | 18.8 | 6 | 13 | 5.7 | 17.6 | 19.5 | 22.6 | 25.1 | 19.8 | 13.7 | 20.1 | 23.1 | 20.9 | 24 | 22.3 | 23.5 | 32.2 | 33.7 | 43.1 | 31.1 | 17.9 | 29.1 | 41.4 | 18.2 | 35.1 | 34 | 36.8 | |||
| 2018-05-11 | 131 | Avg | 0-15cm | 0 | 0 | |||||||||||||||||||||||||||||||||||||||||||||
| 2018-05-11 | 131 | Avg | 15-30cm | 0 | 0 | |||||||||||||||||||||||||||||||||||||||||||||
| 2018-05-11 | 131 | Avg | 30-45cm | 0 | 0 | |||||||||||||||||||||||||||||||||||||||||||||
| 2018-05-11 | 131 | Avg | 45-60cm | 0 | 0 |
mode = both
Moisture Point Probes VR
Array
(
[0] => Solar_Panels_1
[1] => Flux_Tower_1
[2] => Gate_1
[3] => Biomass_Cage_1
[4] => Solar_Panels_2
[5] => Flux_Tower_2
[6] => Gate_2
[7] => Biomass_Cage_2
[8] => Solar_Panels_3
[9] => Flux_Tower_3
[10] => Gate_3
[11] => Biomass_Cage_3
[12] => Solar_Panels_4
[13] => Flux_Tower_4
[14] => Gate_4
[15] => Biomass_Cage_4
)
| Date | DOY | Rep | Depth | Solar_Panels_1 |
Flux_Tower_1 |
Gate_1 |
Biomass_Cage_1 |
Solar_Panels_2 |
Flux_Tower_2 |
Gate_2 |
Biomass_Cage_2 |
Solar_Panels_3 |
Flux_Tower_3 |
Gate_3 |
Biomass_Cage_3 |
Solar_Panels_4 |
Flux_Tower_4 |
Gate_4 |
Biomass_Cage_4 |
Avg | Spacial Count |
Measurement Count |
|---|---|---|---|---|---|---|---|---|---|---|---|---|---|---|---|---|---|---|---|---|---|---|
| 2018-05-11 | 131 | 0 | nan | 5.8 | 2.1 | 3.6 | 1.8 | 10.9 | 13.8 | 11.2 | 9 | 17.6 | 10.1 | 10.9 | 18.1 | 30.5 | 21.9 | 12.5 | 21.6 | |||
| 2018-05-11 | 131 | 1 | nan | 7.4 | 0.3 | 5.6 | 2.1 | 10.9 | 16.7 | 10.2 | 7.5 | 17.6 | 12.9 | 10.9 | 18.7 | 31.4 | 18.5 | 10.2 | 20.5 | |||
| 2018-05-11 | 131 | Avg | 0-15cm | 0 | 0 | |||||||||||||||||
| 2018-05-11 | 131 | Avg | 15-30cm | 0 | 0 | |||||||||||||||||
| 2018-05-11 | 131 | Avg | 30-45cm | 0 | 0 | |||||||||||||||||
| 2018-05-11 | 131 | Avg | 45-60cm | 0 | 0 |
Grass Height TZ 15
| Date | Height reps (cm) | Location | Average | Samp | STDEV | ||||||||||||||
|---|---|---|---|---|---|---|---|---|---|---|---|---|---|---|---|---|---|---|---|
| 2018-05-11 | 47 | 38 | 28 | 27 | 20 | 30 | 32 | 28 | 32 | 29 | 28 | 30 | 27 | 29 | 28 | GH_ALL | 30.2 | 15 | 5.75 |
Grass Height VR 15
| Date | Height reps (cm) | Location | Average | Samp | STDEV | ||||||||||||||
|---|---|---|---|---|---|---|---|---|---|---|---|---|---|---|---|---|---|---|---|
| 2018-05-11 | 80 | 43 | 50 | 86 | 55 | 46 | 47 | 48 | 40 | 34 | 35 | 30 | 38 | 23 | 20 | GH_ALL | 45 | 15 | 17.66 |
Tree DBH
| Date | Tag# | Reading (mm) |
|---|---|---|
| 2018-05-11 | 1 | 13.8 |
| 2018-05-11 | 102 | |
| 2018-05-11 | 2 | 22.3 |
| 2018-05-11 | 245 | 9.2 |
| 2018-05-11 | 3 | 17 |
| 2018-05-11 | 4 | 8.2 |
| 2018-05-11 | 5 | 7.8 |
| 2018-05-11 | 7 | 21.3 |
| 2018-05-11 | 72 | 14.2 |
| 2018-05-11 | 79 | 12.0 |
| 2018-05-11 | 8 | 23.8 |
Water Potential - mode: raw
| Time | Species | Tree | readings (bar) | ||
|---|---|---|---|---|---|
| 2018-05-11 12:38:00 | OAK | 102 | -7 | -8 | -8 |
| 2018-05-11 12:38:00 | OAK | 35 | -17 | -22 | -31 |
| 2018-05-11 12:38:00 | OAK | 92 | -24 | -23 | -32 |
| 2018-05-11 13:03:00 | PINE | OLD | -20 | -1 | -13 |
| 2018-05-11 13:03:00 | PINE | YNG | -5 | -4 | -7 |
No TZ Grass Biomass data found
No TZ OakLeaves Biomass data found
No TZ PineNeedles Biomass data found
1 photos found
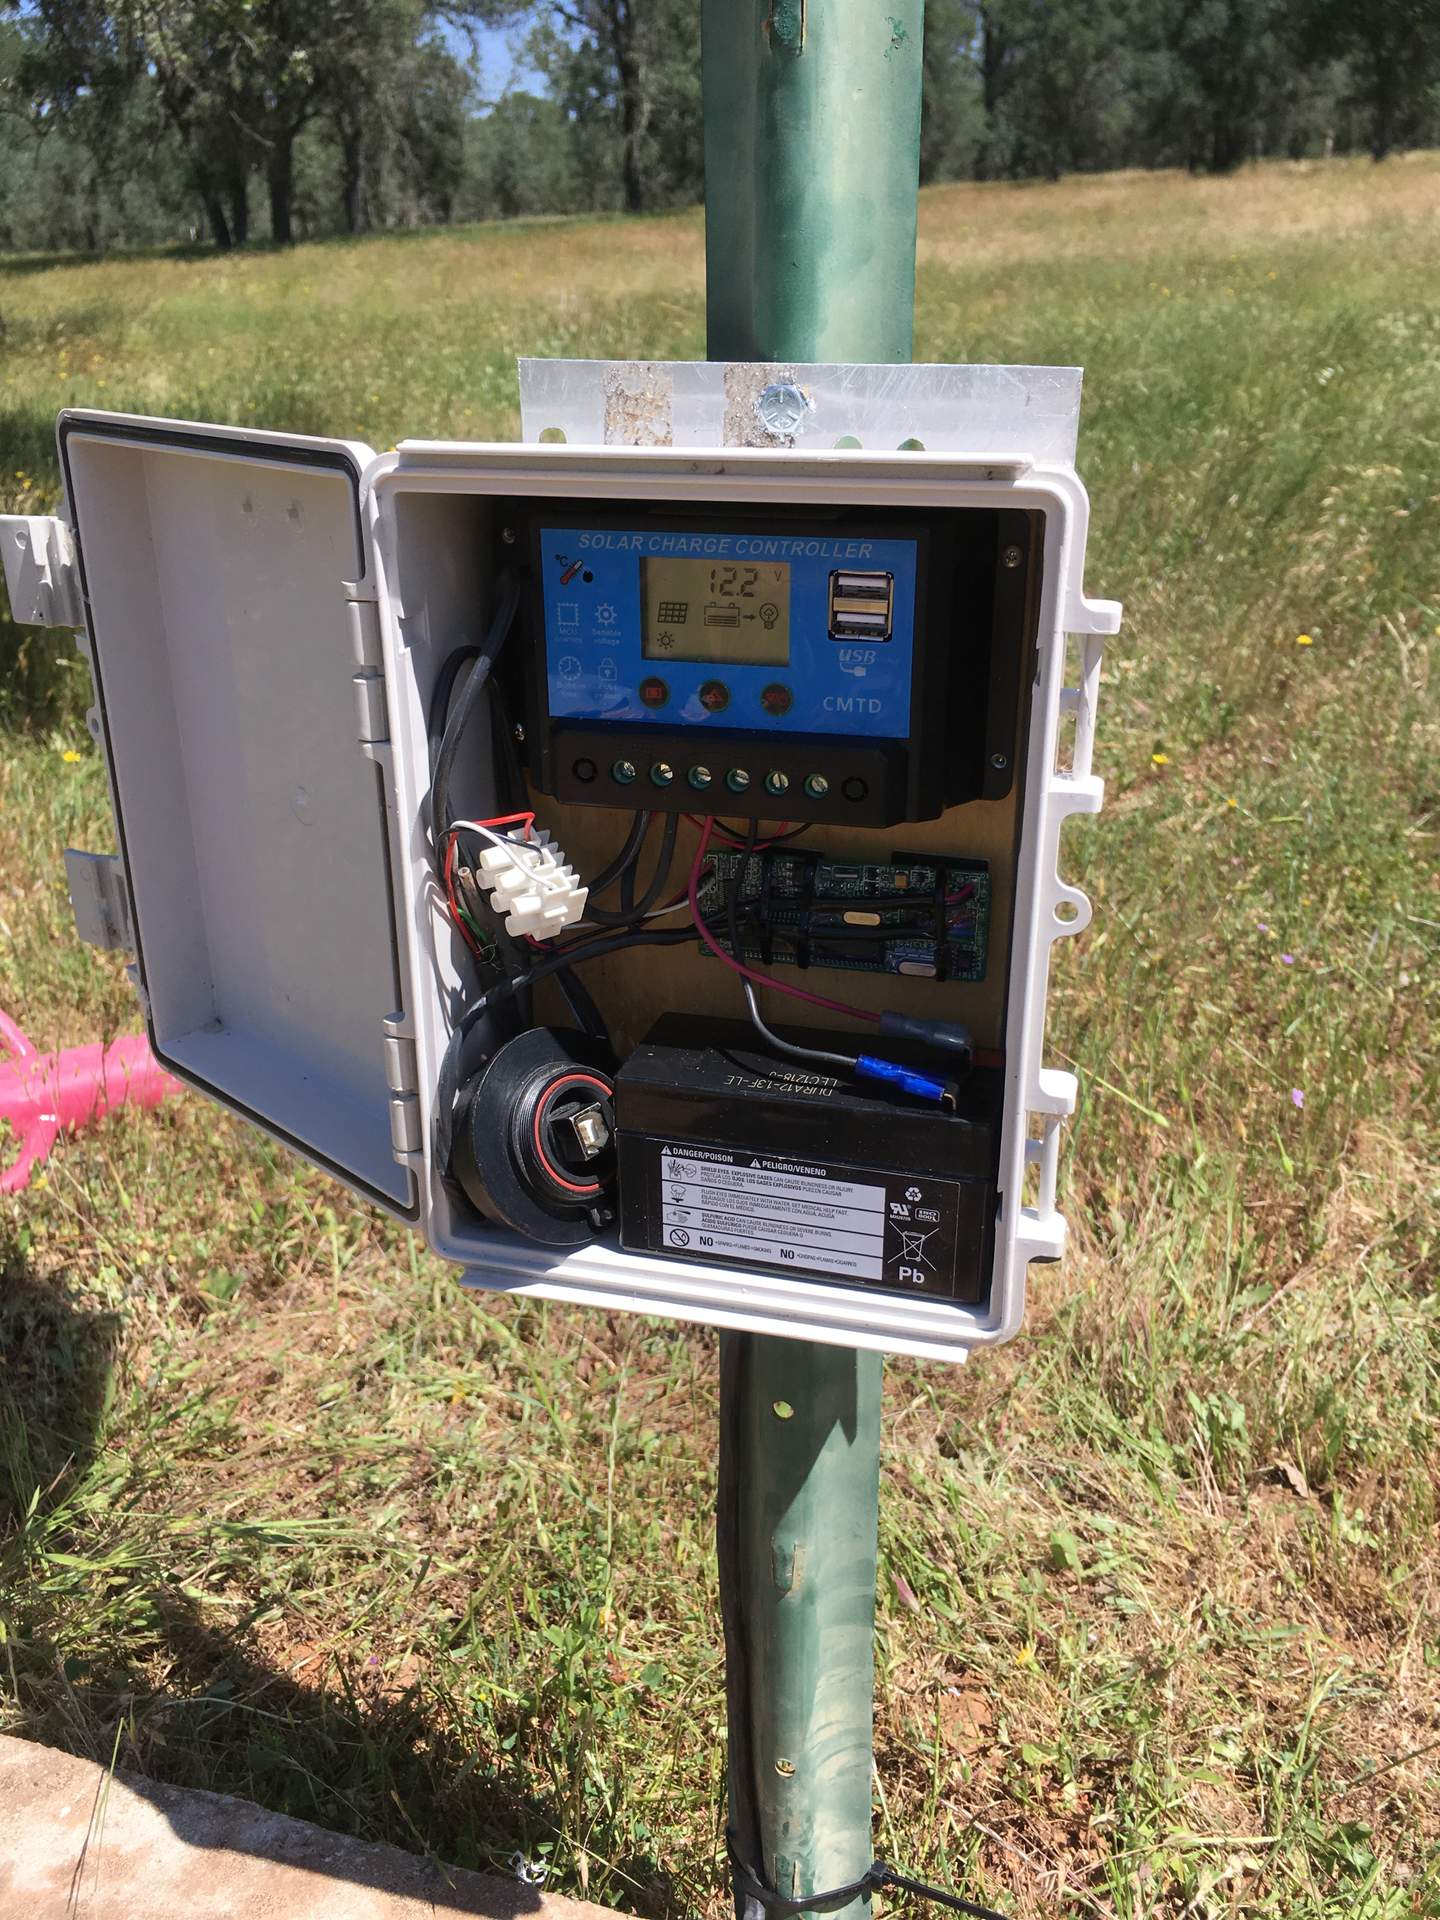
20180511TZ_GWSensorRoadWell.jpg ( 2018-05-11 11:36:44 ) Full size: 1440x1920
Installed Global Water logger at Road Well
16 sets found
No data found for TZ_Fenergy.
11 TZ_tmet graphs found
11 TZ_soilco2 graphs found
Can't check TZ_mixed
3 TZ_mixed graphs found
1 TZ_fflux graphs found
8 TZ_fmet graphs found
No data found for TZ_tram.
3 TZ_co2prof graphs found
1 TZ_irt graphs found
No data found for TZ_windprof.
1 TZ_tflux graphs found
2 TZ_sm graphs found
Can't check TZ_met
1 TZ_met graphs found
Can't check TZVR_mixed
8 TZ_osu graphs found
No data found for TZ_fd.
Tonzi Z-cam data