Field Notes

<--2018-02-28 15:10:00 | 2018-04-05 14:40:00-->
Other sites visited today: Twitchell Alfalfa | East End | West Pond | Mayberry | Sherman Wetland | Bouldin Corn

Bouldin Alfalfa: 2018-03-19 11:00:00 (DOY 78)
Author: Alex Valach
Others: JV, SC

Summary: Data collection

Arrived 11:00 PST
Conditions: cool, sunny, cirrus clouds, E breeze.
Alfalfa looks healthy and growing.

Downloaded data (USB, Cam, Met)

CO2: 424
H2O: 380
T: 15.8
P: 102.0
rssi: 107.3 (108.3 cleaned)

CH4: 2.19
rssi: 59.4 (82.6 cleaned)

AV LAI measurements with 2200.
SC Veg height and clip plots.

Note: StarDot names NOT changed.
Licor GHG columns NOT fixed (looked at, but no solution).
Note: look at anemometer correction on site setup page.

Left 11.30 PST

Next Mowing: 2018-03-30

Veg Height (cm): Tape measure from ground to top of plant
30, 20, 18, 20, 24, 33, 35, 22, 29, 21, 19, 22, 24, 22, 17, 17, 24, 19, 20, 20, avg = 22.8, stdev = 5.15

2 photos found

Bee
bouldinalfalfa_2018_03_19_114606.jpg ( 2018-03-19 11:47:32 ) Full size: 1296x960
Bee

Clip plot bags
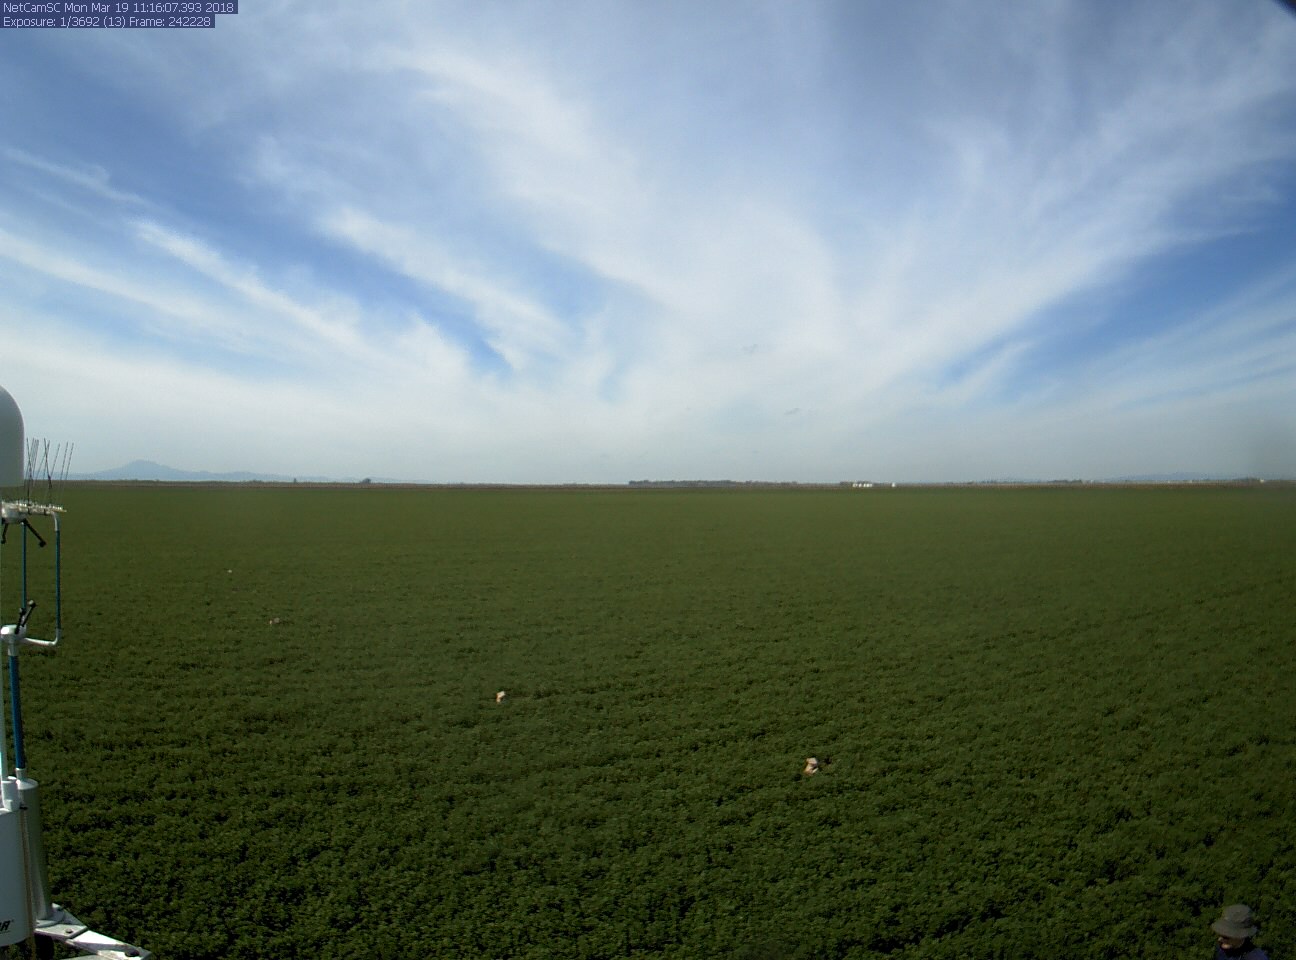
bouldinalfalfa_2018_03_19_111606.jpg ( 2018-03-19 11:17:32 ) Full size: 1296x960
Clip plot bags

Graphs display:
7 sets found

5 BA_flux graphs found

Explore the graph:Wind in a new window

Explore the graph:LI-7500 CO2 and H2O in a new window

Explore the graph:7700 CH4 and RSSI in a new window

Explore the graph:Counts in a new window

Explore the graph:CO2 in ppm in a new window

21 BA_met graphs found

Explore the graph:Soil Temperatures Set A in a new window

Explore the graph:Soil Temperatures Set B in a new window

Explore the graph:Soil Temperatures Set C in a new window

Explore the graph:Soil Heat Flux in a new window

Explore the graph:Temperature in a new window

Explore the graph:Solar Radiation in a new window

Explore the graph:Air Pressure and RH in a new window

Explore the graph:Soil Moisture in a new window

Explore the graph:PAR in a new window

Explore the graph:PRI Channels in a new window

Explore the graph:NDVI channels in a new window

Explore the graph:Battery Voltage in a new window

Explore the graph:NDVI and PRI in a new window

Explore the graph:Apogee NDVI in a new window

Explore the graph:FD Chamber A CO2 and Temp in a new window

Explore the graph:FD Chamber B CO2 and Temperature in a new window

Explore the graph:Surface Temperature in a new window

Explore the graph:Sentek Soil Moisture profile in a new window

Explore the graph:Sentek Soil Temperature profile in a new window

Explore the graph:Sentek Soil Salinity profile in a new window

Explore the graph:Forced Diffusion Soil CO2 Flux in a new window

6 BA_arable graphs found

Explore the graph:Incoming Solar Bands in a new window

Explore the graph:Reflected Solar Bands in a new window

Explore the graph:Solar Radiation in a new window

Explore the graph:Temperatures, PPT in a new window

Explore the graph:Sentek Deep Soil Moisture in a new window

Explore the graph:Pressure, RH in a new window

Can't check TATWBABCSB_cam
Can't check MBSWEEWPBCBA
2 BA_processed graphs found

Explore the graph:Energy in a new window

Explore the graph:Evapotranspiration in a new window

No data found for BA_adex.