
Field Notes
<--2017-12-14 09:30:00 | 2018-01-03 10:00:00-->Other sites visited today: Vaira | Tonzi
Phenocam link: Searching...
Tonzi: 2017-12-14 11:00:00 (DOY 348)
Author: Joe Verfaillie
Others: Siyan
Summary: Calibration of soil co2 sensors with zero air, pulled broken Moisture Point, shutdown Tower CO2 profile and brought in LI-820 for cleaning and cal.
| Tonzi 2017-12-14 I arrived with Siyan at about 11am. It was clear sunny and mild without a breath of wind. The ground is still damp in the low places but no puddles. The trees no longer have leaves at all. I worked on recalibrating the soil co2 profiles, this time using zero air to go all the way to zero. The small tank of zero air I had nearly ran out and I refilled it partially from the N2 tank for the tower CO2 profile. After downloading the 23x data I uploaded a new program that starts recoding 10sec samples when flag 8 is set high. All three profiles seemed to calibrate okay. I collected the data from both FD chambers then cleared their data. The pump on the FD chamber sn 20160002 in the Open (East) location seems to be running but both CO2 concentrations are the same. Maybe there is a solenoid or something that is not switching between cells properly. I removed the chamber since it’s not working. Both chambers here also had some sprouting grass inside their collars but not as much as Vaira. I pulled out the Moisture Point probe sn 000000574632 near the soil co2 profiles that has not been working for a while. Its bottom most pin is broken, but I don’t think that pin is used. I checked on the Tower co2 profile. The LI-820 sn CGA-556 was giving mostly bad readings. I shut off the gas, the pump and the solenoids and brought back the LI-820 for cleaning and calibration in the lab. Siyan did all the data collection and regular fieldwork. |
Field Data
No tank data
Well Depth
| Date | Location | Depth (feet) |
|---|---|---|
| 2017-12-14 | TZ_floor | 28.6 |
| 2017-12-14 | TZ_road | 37.4 |
| 2017-12-14 | TZ_tower | 33.6 |
mode = both
Moisture Point Probes TZ
Array
(
[0] => Tower_1
[1] => Floor_South_1
[2] => Floor_East_1
[3] => Floor_West_1
[4] => Soil_Transect_4_1
[5] => Soil_Transect_3_1
[6] => Soil_Transect_2_1
[7] => Soil_Transect_1_1
[8] => SoilCO2_West_A_1
[9] => SoilCO2_West_B_1
[10] => SoilCO2_West_C_1
[11] => Tower_2
[12] => Floor_South_2
[13] => Floor_East_2
[14] => Floor_West_2
[15] => Soil_Transect_4_2
[16] => Soil_Transect_3_2
[17] => Soil_Transect_2_2
[18] => Soil_Transect_1_2
[19] => SoilCO2_West_A_2
[20] => SoilCO2_West_B_2
[21] => SoilCO2_West_C_2
[22] => Tower_3
[23] => Floor_South_3
[24] => Floor_East_3
[25] => Floor_West_3
[26] => Soil_Transect_4_3
[27] => Soil_Transect_3_3
[28] => Soil_Transect_2_3
[29] => Soil_Transect_1_3
[30] => SoilCO2_West_A_3
[31] => SoilCO2_West_B_3
[32] => SoilCO2_West_C_3
[33] => Tower_4
[34] => Floor_South_4
[35] => Floor_East_4
[36] => Floor_West_4
[37] => Soil_Transect_4_4
[38] => Soil_Transect_3_4
[39] => Soil_Transect_2_4
[40] => Soil_Transect_1_4
[41] => SoilCO2_West_A_4
[42] => SoilCO2_West_B_4
[43] => SoilCO2_West_C_4
)
| Date | DOY | Rep | Depth | Tower_1 |
Floor_South_1 |
Floor_East_1 |
Floor_West_1 |
Soil_Transect_4_1 |
Soil_Transect_3_1 |
Soil_Transect_2_1 |
Soil_Transect_1_1 |
SoilCO2_West_A_1 |
SoilCO2_West_B_1 |
SoilCO2_West_C_1 |
Tower_2 |
Floor_South_2 |
Floor_East_2 |
Floor_West_2 |
Soil_Transect_4_2 |
Soil_Transect_3_2 |
Soil_Transect_2_2 |
Soil_Transect_1_2 |
SoilCO2_West_A_2 |
SoilCO2_West_B_2 |
SoilCO2_West_C_2 |
Tower_3 |
Floor_South_3 |
Floor_East_3 |
Floor_West_3 |
Soil_Transect_4_3 |
Soil_Transect_3_3 |
Soil_Transect_2_3 |
Soil_Transect_1_3 |
SoilCO2_West_A_3 |
SoilCO2_West_B_3 |
SoilCO2_West_C_3 |
Tower_4 |
Floor_South_4 |
Floor_East_4 |
Floor_West_4 |
Soil_Transect_4_4 |
Soil_Transect_3_4 |
Soil_Transect_2_4 |
Soil_Transect_1_4 |
SoilCO2_West_A_4 |
SoilCO2_West_B_4 |
SoilCO2_West_C_4 |
Avg | Spacial Count |
Measurement Count |
|---|---|---|---|---|---|---|---|---|---|---|---|---|---|---|---|---|---|---|---|---|---|---|---|---|---|---|---|---|---|---|---|---|---|---|---|---|---|---|---|---|---|---|---|---|---|---|---|---|---|---|
| 2017-12-14 | 348 | 0 | nan | 19.4 | 188 | 30.5 | 25.8 | 17.9 | 22.3 | 18.5 | 10.3 | 25.6 | 26.1 | 12.7 | 28 | 30.4 | 31.9 | 20.6 | 22.2 | 30.1 | 30.1 | 12.1 | 24 | 17.6 | 28.6 | 27.4 | 37.4 | 38.5 | 31 | 22.3 | 29 | 30.7 | 25.4 | 35.2 | 32.1 | 36 | 35.7 | 35.1 | 42 | 41.4 | 26.2 | 41.1 | 38 | 16.5 | 39.1 | 45.7 | 45.4 | |||
| 2017-12-14 | 348 | 1 | nan | 18.5 | 18.5 | 31.4 | 17.6 | 23.5 | 18.5 | 10.3 | 26.7 | 26.1 | 12.4 | 27.7 | 31 | 31.6 | 21.6 | 21.9 | 30.1 | 29.2 | 11.8 | 24 | 17.6 | 26.3 | 26.2 | 37.4 | 38 | 32.1 | 21.8 | 29.6 | 30.1 | 25.1 | 32.7 | 31.8 | 36.6 | 35.7 | 36.8 | 40.3 | 41.7 | 25.9 | 40.8 | 38.5 | 16.8 | 39.1 | 46 | 45.1 | ||||
| 2017-12-14 | 348 | Avg | 0-15cm | 0 | 0 | |||||||||||||||||||||||||||||||||||||||||||||
| 2017-12-14 | 348 | Avg | 15-30cm | 0 | 0 | |||||||||||||||||||||||||||||||||||||||||||||
| 2017-12-14 | 348 | Avg | 30-45cm | 0 | 0 | |||||||||||||||||||||||||||||||||||||||||||||
| 2017-12-14 | 348 | Avg | 45-60cm | 0 | 0 |
mode = both
Moisture Point Probes VR
Array
(
[0] => Solar_Panels_1
[1] => Flux_Tower_1
[2] => Gate_1
[3] => Biomass_Cage_1
[4] => Solar_Panels_2
[5] => Flux_Tower_2
[6] => Gate_2
[7] => Biomass_Cage_2
[8] => Solar_Panels_3
[9] => Flux_Tower_3
[10] => Gate_3
[11] => Biomass_Cage_3
[12] => Solar_Panels_4
[13] => Flux_Tower_4
[14] => Gate_4
[15] => Biomass_Cage_4
)
| Date | DOY | Rep | Depth | Solar_Panels_1 |
Flux_Tower_1 |
Gate_1 |
Biomass_Cage_1 |
Solar_Panels_2 |
Flux_Tower_2 |
Gate_2 |
Biomass_Cage_2 |
Solar_Panels_3 |
Flux_Tower_3 |
Gate_3 |
Biomass_Cage_3 |
Solar_Panels_4 |
Flux_Tower_4 |
Gate_4 |
Biomass_Cage_4 |
Avg | Spacial Count |
Measurement Count |
|---|---|---|---|---|---|---|---|---|---|---|---|---|---|---|---|---|---|---|---|---|---|---|
| 2017-12-14 | 348 | 0 | nan | 16.5 | 15.3 | 20.3 | 12.1 | 25.8 | 27.4 | 19.1 | 19.7 | 29.3 | 15.4 | 21.8 | 29.9 | 41.4 | 27.4 | 20.5 | 29.9 | |||
| 2017-12-14 | 348 | 1 | nan | 12.1 | 15 | 20.3 | 13 | 25.5 | 28.6 | 19.4 | 19.1 | 29.3 | 15.1 | 22.6 | 29 | 40.5 | 27.1 | 20.8 | 30.2 | |||
| 2017-12-14 | 348 | Avg | 0-15cm | 0 | 0 | |||||||||||||||||
| 2017-12-14 | 348 | Avg | 15-30cm | 0 | 0 | |||||||||||||||||
| 2017-12-14 | 348 | Avg | 30-45cm | 0 | 0 | |||||||||||||||||
| 2017-12-14 | 348 | Avg | 45-60cm | 0 | 0 |
No TZ grass heigth found
No VR grass heigth found
Tree DBH
| Date | Tag# | Reading (mm) |
|---|---|---|
| 2017-12-14 | 1 | 13.5 |
| 2017-12-14 | 102 | 9.1 |
| 2017-12-14 | 2 | 21.3 |
| 2017-12-14 | 245 | 8.0 |
| 2017-12-14 | 3 | 13.1 |
| 2017-12-14 | 4 | 7.5 |
| 2017-12-14 | 5 | 5.8 |
| 2017-12-14 | 7 | 19.8 |
| 2017-12-14 | 72 | 10.9 |
| 2017-12-14 | 79 | 10.1 |
| 2017-12-14 | 8 | 23.0 |
No water potential data found
No TZ Grass Biomass data found
No TZ OakLeaves Biomass data found
No TZ PineNeedles Biomass data found
1 photos found
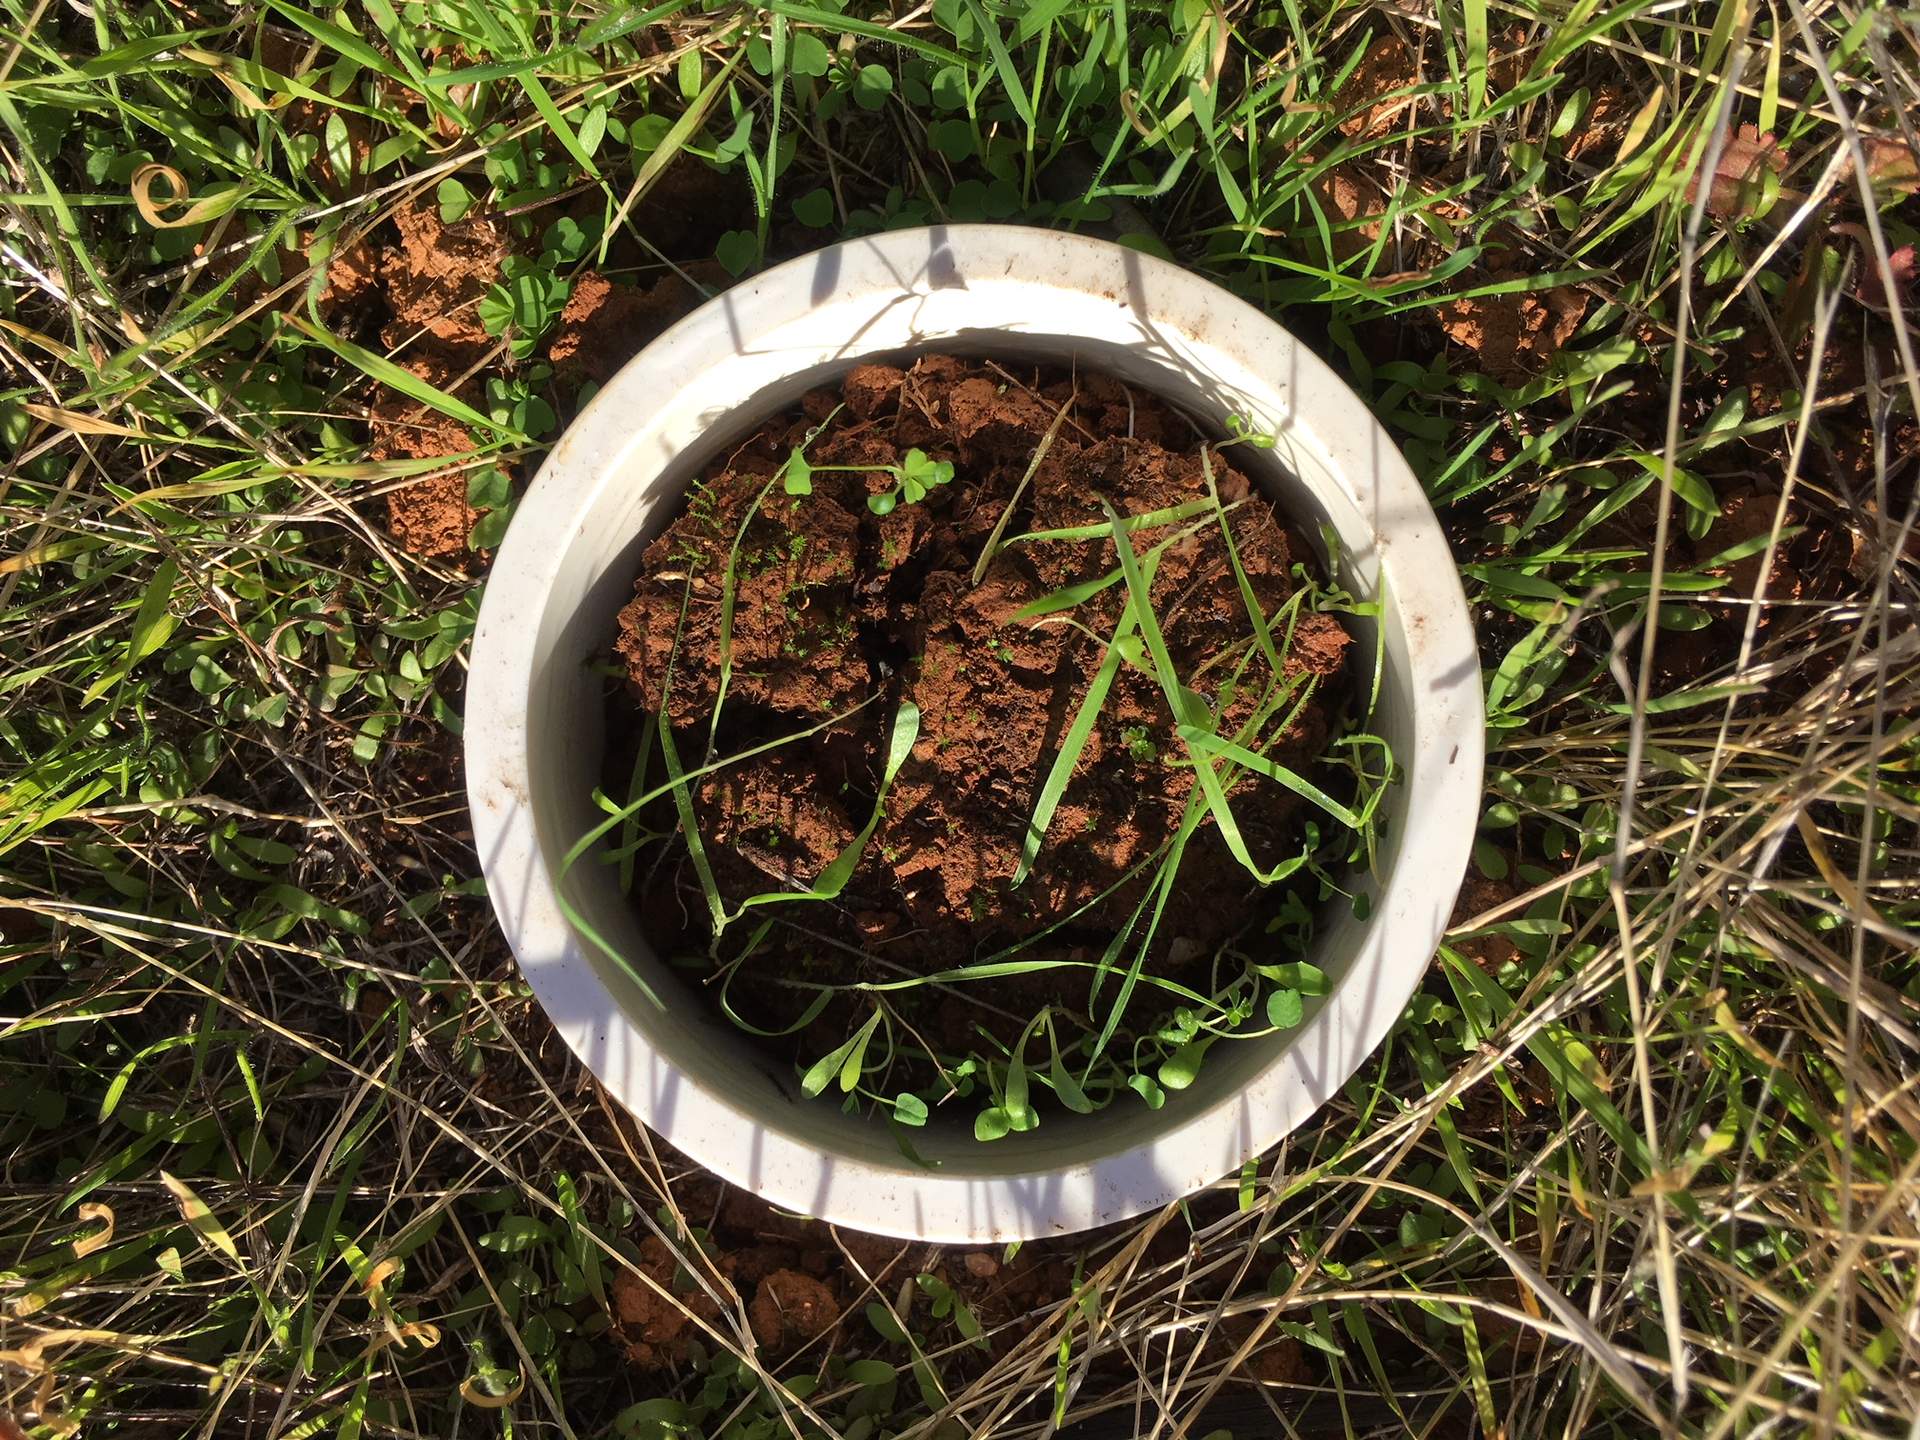
20171214TZ_FDGreenhouse.jpg ( 2017-12-14 13:21:50 ) Full size: 1920x1440
Grass growing inside FD Chamber collar
16 sets found
No data found for TZ_Fenergy.
11 TZ_tmet graphs found
11 TZ_soilco2 graphs found
Can't check TZ_mixed
3 TZ_mixed graphs found
1 TZ_fflux graphs found
8 TZ_fmet graphs found
No data found for TZ_tram.
No data found for TZ_co2prof.
1 TZ_irt graphs found
No data found for TZ_windprof.
1 TZ_tflux graphs found
2 TZ_sm graphs found
Can't check TZ_met
1 TZ_met graphs found
Can't check TZVR_mixed
No data found for TZ_osu.
3 TZ_fd graphs found
Tonzi Z-cam data