
Field Notes
<--2017-11-10 10:40:00 | 2017-11-30 11:35:00-->Other sites visited today: Mayberry | Sherman Wetland | East End | Twitchell Alfalfa
Phenocam link: Searching...
Bouldin Corn: 2017-11-17 14:30:00 (DOY 321)
Author: Daphne Szutu
Others: Joe
Summary: Fixed VWC/PRI/NDVI/dfPAR sensors, downloaded met data
| 2017-11-17 Bouldin Corn We arrived at 14:30. It was windy and cool, with clear skies. We came in through the red gate by the underpass. The construction company is building up the road in front of the Duck Club. VWC, PRI, NDVI, and diffuse PAR data have been NAN since Oct 26. These sensors were all on C5. The diffuse PAR sensor C and G wires were switched, which was probably messing up all the sensors on C5. We fixed the diffuse PAR wiring and moved all sensors to C7. I uploaded a new program to reflect the new wiring, BC_Met_20171117.CR1. The numbers now look reasonable. The flux numbers looked reasonable. We left at 15:00. In an email from Heather she said that Tyler met John Meek at Bouldin today. John said they will be gradually flooding the corn field over the next two weeks. The deepest locations could have up to two feet of water. |
1 photos found
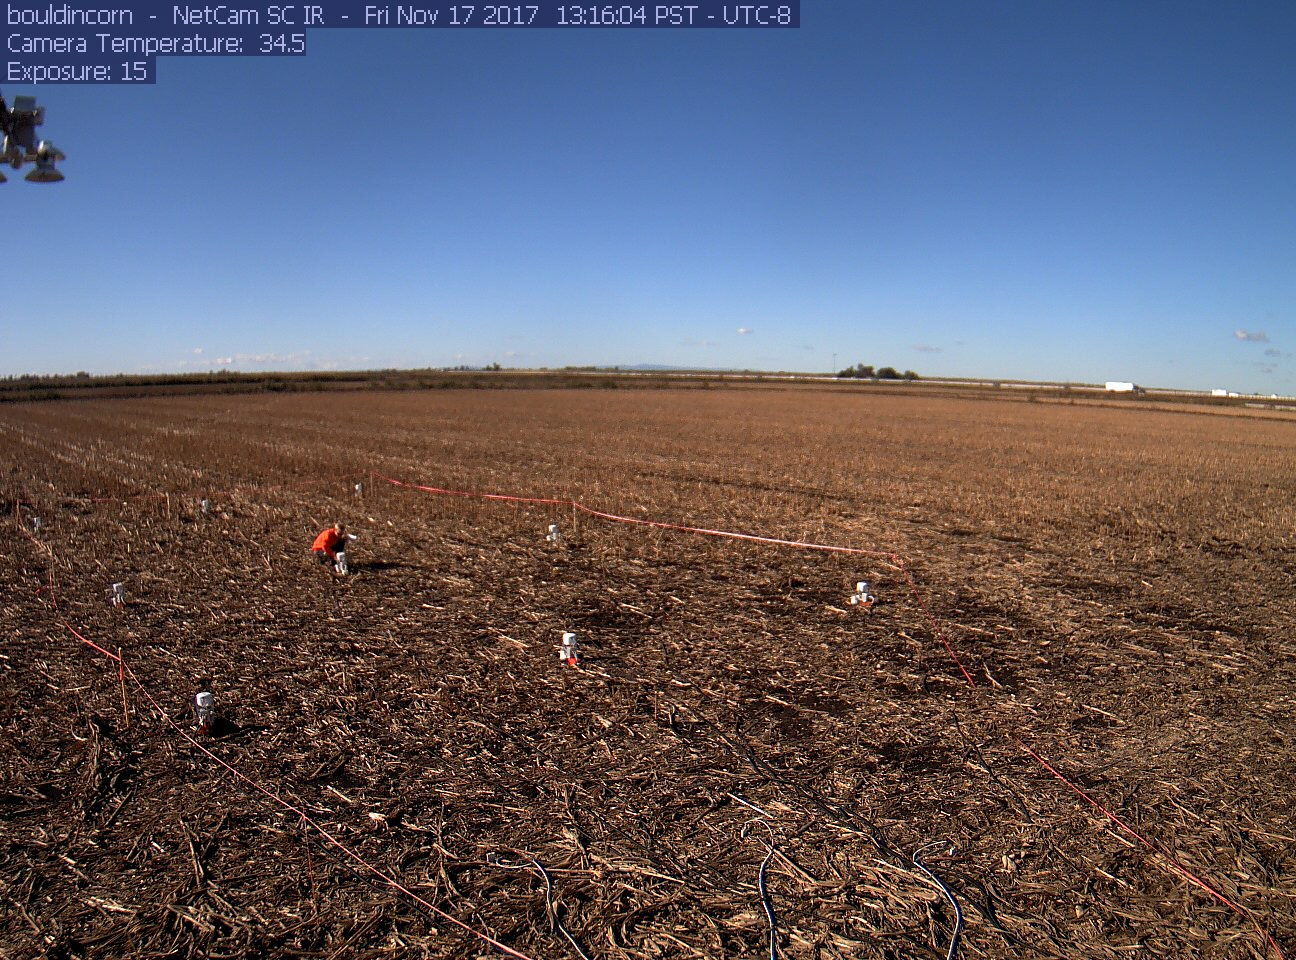
bouldincorn_2017_11_17_131506.jpg ( 2017-11-17 13:22:26 ) Full size: 1296x960
Tyler working on chambers
6 sets found
17 BC_met graphs found
5 BC_flux graphs found
Can't check TATWBABCSB_cam
Can't check MBSWEEWPBCBA
No data found for BC_pa.
No data found for BC_arable.