
Field Notes
<--2017-09-14 14:30:00 | 2017-09-21 10:30:00-->Other sites visited today: Vaira | Twitchell Alfalfa
Phenocam link: Searching...
Vaira: 2017-09-21 09:30:00 (DOY 264)
Author: Siyan Ma
Others: Joe, Daphne
Summary: Standard fieldwork, spectrum and litter collections, upgraded soil co2 system, upgraded Tonzi tower met CR1000 OS
|
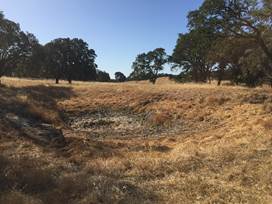
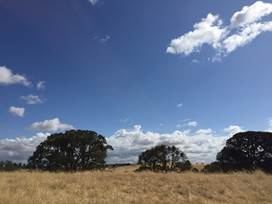
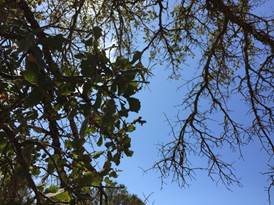
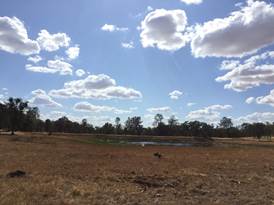
When: Date: 9/21/2017 , Watch Time: 9:30 am . Where: Tonzi/Vaira Ranch Who: Siyan, Daphne, Joe Weather: sunny Phenology: The little pond dried out; much less green leaves on the tree.
Summary
Vaira_Grass Site
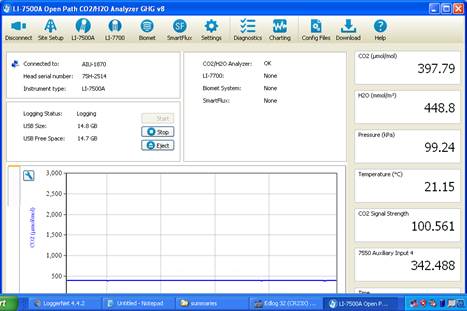
Tower & Floor (Daphne) We arrived at Tonzi around 12:00. It was partly cloudy and cool, with fluffy/stormy clouds to the N and E.I updated the Tonzi tower met CR1000 sn 50890 OS from version 27 to version 31.08. I reset the IP address to 192.168.2.100, subnet to 255.255.255.0, IP Gateway to 192.168.2.1, and enabled FTP with user Tower and pw biomet. I downloaded tower met, tower GHG, floor met/sm, floor GHG, soil CO2 data, and IRT data. At the soil CO2 CR23X, I synced the clock: when station was 1/7/2020 11:21:28, I changed it to 9/21/2017 12:08:26. I also swapped zcam cards. I cleaned the radiation and flux sensors at the tower and the floor. When I collected tower GHG, a fresh USB stick that just came from Vaira was not recognized by the LI-7550, so I emptied and re-used the current USB. Tower LI-7500 readings: CO2 397.7 H2O 368.9 T 17.9 P 98.8 SS 87.5 --> 88.5 after cleaning Floor LI-7500 readings: CO2 403.9 H2O 335.4 T 22.5 P 98.9 SS 96.3 --> 99.9 We left Tonzi at 14:20 and stopped at Vaira to pick up Joe before heading home. |
Field Data
No tank data
Well Depth
| Date | Location | Depth (feet) |
|---|---|---|
| 2017-09-21 | TZ_floor | 24.8 |
| 2017-09-21 | TZ_road | 34.3 |
| 2017-09-21 | TZ_tower | 29.8 |
mode = both
Moisture Point Probes TZ
Array
(
[0] => Tower_1
[1] => Floor_South_1
[2] => Floor_East_1
[3] => Floor_West_1
[4] => Soil_Transect_4_1
[5] => Soil_Transect_3_1
[6] => Soil_Transect_2_1
[7] => Soil_Transect_1_1
[8] => SoilCO2_West_A_1
[9] => SoilCO2_West_B_1
[10] => SoilCO2_West_C_1
[11] => Tower_2
[12] => Floor_South_2
[13] => Floor_East_2
[14] => Floor_West_2
[15] => Soil_Transect_4_2
[16] => Soil_Transect_3_2
[17] => Soil_Transect_2_2
[18] => Soil_Transect_1_2
[19] => SoilCO2_West_A_2
[20] => SoilCO2_West_B_2
[21] => SoilCO2_West_C_2
[22] => Tower_3
[23] => Floor_South_3
[24] => Floor_East_3
[25] => Floor_West_3
[26] => Soil_Transect_4_3
[27] => Soil_Transect_3_3
[28] => Soil_Transect_2_3
[29] => Soil_Transect_1_3
[30] => SoilCO2_West_A_3
[31] => SoilCO2_West_B_3
[32] => SoilCO2_West_C_3
[33] => Tower_4
[34] => Floor_South_4
[35] => Floor_East_4
[36] => Floor_West_4
[37] => Soil_Transect_4_4
[38] => Soil_Transect_3_4
[39] => Soil_Transect_2_4
[40] => Soil_Transect_1_4
[41] => SoilCO2_West_A_4
[42] => SoilCO2_West_B_4
[43] => SoilCO2_West_C_4
)
| Date | DOY | Rep | Depth | Tower_1 |
Floor_South_1 |
Floor_East_1 |
Floor_West_1 |
Soil_Transect_4_1 |
Soil_Transect_3_1 |
Soil_Transect_2_1 |
Soil_Transect_1_1 |
SoilCO2_West_A_1 |
SoilCO2_West_B_1 |
SoilCO2_West_C_1 |
Tower_2 |
Floor_South_2 |
Floor_East_2 |
Floor_West_2 |
Soil_Transect_4_2 |
Soil_Transect_3_2 |
Soil_Transect_2_2 |
Soil_Transect_1_2 |
SoilCO2_West_A_2 |
SoilCO2_West_B_2 |
SoilCO2_West_C_2 |
Tower_3 |
Floor_South_3 |
Floor_East_3 |
Floor_West_3 |
Soil_Transect_4_3 |
Soil_Transect_3_3 |
Soil_Transect_2_3 |
Soil_Transect_1_3 |
SoilCO2_West_A_3 |
SoilCO2_West_B_3 |
SoilCO2_West_C_3 |
Tower_4 |
Floor_South_4 |
Floor_East_4 |
Floor_West_4 |
Soil_Transect_4_4 |
Soil_Transect_3_4 |
Soil_Transect_2_4 |
Soil_Transect_1_4 |
SoilCO2_West_A_4 |
SoilCO2_West_B_4 |
SoilCO2_West_C_4 |
Avg | Spacial Count |
Measurement Count |
|---|---|---|---|---|---|---|---|---|---|---|---|---|---|---|---|---|---|---|---|---|---|---|---|---|---|---|---|---|---|---|---|---|---|---|---|---|---|---|---|---|---|---|---|---|---|---|---|---|---|---|
| 2017-09-21 | 264 | 0 | nan | 3 | 5.2 | 3.9 | 2.1 | 1.6 | 0.9 | 4.2 | 0.4 | 3.9 | 6.8 | 1.2 | 13 | 11.2 | 11.1 | 3.5 | 8.1 | 13.6 | 11.8 | 4.5 | 6.6 | 10.6 | 11.5 | 15.4 | 8.1 | 15.8 | 14 | 9.2 | 15.6 | 15.9 | 13.4 | 17.3 | 15.9 | 14.3 | 15.3 | 3.6 | 16.9 | 17 | 11 | 18.8 | 27.9 | 11.6 | 17.6 | 13.6 | 35.4 | |||
| 2017-09-21 | 264 | 1 | nan | 2.4 | 5.1 | 3.3 | 4.7 | 2.8 | 1.2 | 3.3 | 0.7 | 3.9 | 7.1 | 0.9 | 13 | 10 | 10.9 | 1.1 | 7.8 | 13.6 | 12.1 | 4.5 | 6.9 | 1.1 | 11.5 | 15.8 | 7.8 | 17 | 13.1 | 9.8 | 15.6 | 16.2 | 13.4 | 16.2 | 15.9 | 14.3 | 15.3 | 3.6 | 16.9 | 17.9 | 12.5 | 18.5 | 28.5 | 11 | 16.8 | 13.3 | 24.8 | |||
| 2017-09-21 | 264 | Avg | 0-15cm | 0 | 0 | |||||||||||||||||||||||||||||||||||||||||||||
| 2017-09-21 | 264 | Avg | 15-30cm | 0 | 0 | |||||||||||||||||||||||||||||||||||||||||||||
| 2017-09-21 | 264 | Avg | 30-45cm | 0 | 0 | |||||||||||||||||||||||||||||||||||||||||||||
| 2017-09-21 | 264 | Avg | 45-60cm | 0 | 0 |
mode = both
Moisture Point Probes VR
Array
(
[0] => Solar_Panels_1
[1] => Flux_Tower_1
[2] => Gate_1
[3] => Biomass_Cage_1
[4] => Solar_Panels_2
[5] => Flux_Tower_2
[6] => Gate_2
[7] => Biomass_Cage_2
[8] => Solar_Panels_3
[9] => Flux_Tower_3
[10] => Gate_3
[11] => Biomass_Cage_3
[12] => Solar_Panels_4
[13] => Flux_Tower_4
[14] => Gate_4
[15] => Biomass_Cage_4
)
| Date | DOY | Rep | Depth | Solar_Panels_1 |
Flux_Tower_1 |
Gate_1 |
Biomass_Cage_1 |
Solar_Panels_2 |
Flux_Tower_2 |
Gate_2 |
Biomass_Cage_2 |
Solar_Panels_3 |
Flux_Tower_3 |
Gate_3 |
Biomass_Cage_3 |
Solar_Panels_4 |
Flux_Tower_4 |
Gate_4 |
Biomass_Cage_4 |
Avg | Spacial Count |
Measurement Count |
|---|---|---|---|---|---|---|---|---|---|---|---|---|---|---|---|---|---|---|---|---|---|---|
| 2017-09-21 | 264 | 0 | nan | 0.1 | 1.9 | 0.6 | 0.3 | 10.6 | 6.3 | 5.1 | 4.5 | 15.6 | 5.3 | 9 | 14.8 | 26.2 | 15 | 11 | 18.2 | |||
| 2017-09-21 | 264 | 1 | nan | 0.9 | 0.4 | 0.9 | 0.4 | 10.6 | 5.7 | 5.7 | 3.5 | 15.4 | 4.5 | 9.5 | 14.3 | 29.1 | 15 | 11 | 18.2 | |||
| 2017-09-21 | 264 | Avg | 0-15cm | 0 | 0 | |||||||||||||||||
| 2017-09-21 | 264 | Avg | 15-30cm | 0 | 0 | |||||||||||||||||
| 2017-09-21 | 264 | Avg | 30-45cm | 0 | 0 | |||||||||||||||||
| 2017-09-21 | 264 | Avg | 45-60cm | 0 | 0 |
No TZ grass heigth found
No VR grass heigth found
No VR Tree DBH found
No water potential data found
No VR Grass Biomass data found
No VR OakLeaves Biomass data found
No VR PineNeedles Biomass data found
0 photos found
9 sets found
16 VR_met graphs found
2 VR_flux graphs found
6 VR_soilco2 graphs found
2 VR_pond graphs found
Can't check TZVR_mixed
No data found for VR_fd.
No data found for VR_processed.
No data found for VR_arable.
No data found for VR_soilvue.