Field Notes
<--2010-06-22 11:00:00 | 2010-07-14 11:00:00-->Other sites visited today: Sherman Island
Phenocam link: Searching...
Twitchell Rice: 2010-07-01 10:00:00 (DOY 182)
Author: Joe Verfaillie
Others: Jaclyn
| Twitchell
7/1/2010 Arrived about 10am with Jaclyn. It was clear, sunny, warm, but enough breeze to keep my long sleeves on. The rice looks okay, still some weeds and a little thin near the tower radiometers. It looks like it was planted less densely this year. I think the rice grew a lot in the last week. I cut grass around the tower and box. In the processes I cut the cable for the Theta probe to the south. I removed this probe to repair in the lab. I also pounded fence posts to mark the tower, box and rain bucket and a junction in the AC line back to the generator. I’m hoping the field crew can mow up to these markers. Systems were okay. The serial port to the CR1000 had hung up for about a week, but the data is safe on the CF card. LGR readings: 9:56, 27.68C, 150.75Torr, 13.927usec, 10Hz, 1.850ppm, 13726ppm, 386.51ppm Met Frank to transfer so data. Left for Sherman about 12:30 |
5 photos found
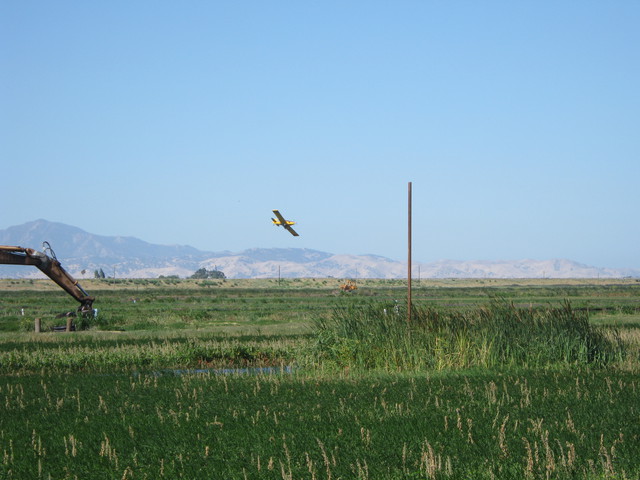
20100701TW_CropDuster1.jpg ( 2010-07-01 09:36:56 ) Full size: 3648x2736
Crop duster over the rice fields
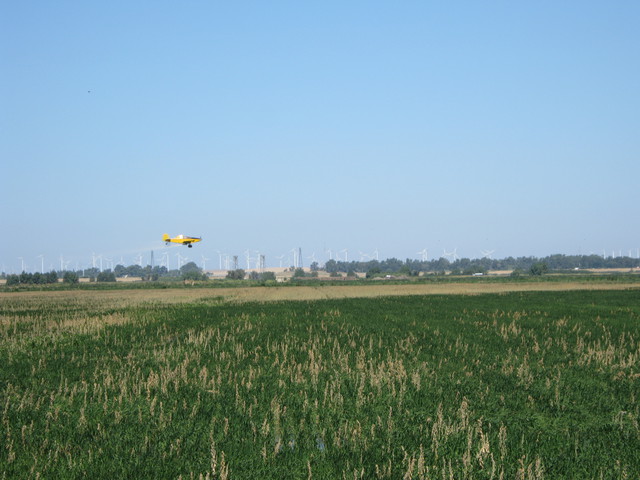
20100701TW_CropDuster2.jpg ( 2010-07-01 09:37:06 ) Full size: 3648x2736
Crop duster over the rice fields
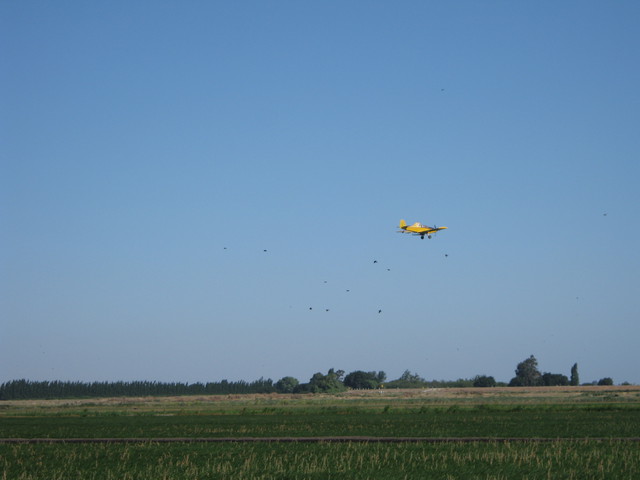
20100701TW_CropDuster3.jpg ( 2010-07-01 09:39:44 ) Full size: 3648x2736
Crop duster over the rice fields
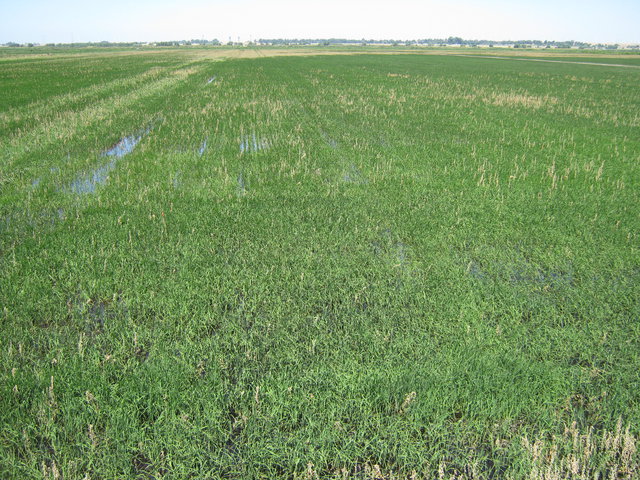
20100701TW_FieldWest.jpg ( 2010-07-01 11:10:44 ) Full size: 3648x2736
Weedy flooded rice field
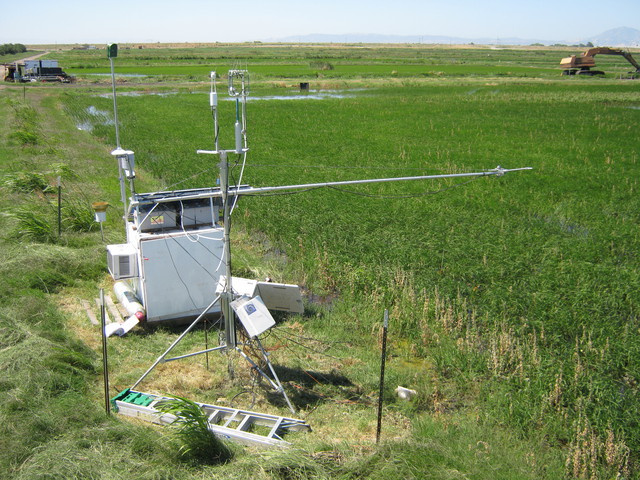
20100701TW_Tower.jpg ( 2010-07-01 11:10:56 ) Full size: 3648x2736
Eddy tower and equipment box at rice field secondary site
6 sets found
12 TW_met graphs found
No data found for TW_flux.
Can't check TWSI_mixed
Can't check SIMBTWEE_met
No data found for TW_cam.
Can't check TATWBABCSB_cam

