
Field Notes
<--2016-07-07 09:30:00 | 2016-07-15 09:30:00-->Other sites visited today: Vaira | Tonzi | Twitchell Rice | Twitchell Alfalfa
Phenocam link: Searching...
Tonzi: 2016-07-07 10:00:00 (DOY 189)
Author: Joe Verfaillie
Others: Siyan
Summary: Connected soilco2 and fmet to tower computer, found line quantum sensor, rotating shadow band stopped, sonic heading, removed wind profile boom.
| Tonzi 2016-07-07 I arrived about 10am with Siyan. It was clear, sunny and hot with a light breeze from the west. The ground and grass is dry and crunchy. The pond is still about half full. There has been a relatively large fire along the south side Twin Cities Rd burning the cow pastures west of the quarry. I worked on getting the soil CO2 and floor met data loggers connected to the tower computer so that their data can be sent to UCB daily. I put the tram radio link on the Soil CO2 CR23x and it connected okay. For the Floor Met, I connected the AM25T to the soil moisture 23x and moved the HMP45 and air pressure wires to the 23x. I collected all the data from the 23x then updated its OS from revision 0006 to 0019. Then I uploaded a new program that collects the met data in Table 1 with a 10sec scan and the soil moisture data in Table 2 with a 30sec scan. All the channels seemed to be recording properly. The CR10x sn 19481 (wp 10202) was removed. Also, in the process of updating this system, I found the Licor quantum line sensor sn LQ1570. It was buried in grass and dirt to the southeast of the boxes. I removed it to clean it up and test it in the lab. I updated the script on the tower computer to send the two new data files and it seemed to run okay at 12:05 PST. The co2 profile system was running but one of the solenoids was sticking intermittently. I wanted to collect the data from the Eosense CO2 probe experiment, but I did not have the correct USB cable. I’ll leave the cable in the box next time. I checked the heading on the Tower sonic. The sonic north is 74 degrees (east) from true north. This changed when the sonic was swapped on 2015-04-29. The rotating shadow band was not rotating. One side of the band was bent and the wire to the PAR sensor had some slack in it. I think a bird may have pulled the wire loose and got it caught on the band. Anyway, I think I will have to replace the motor. I swapped the card on the Tower CR1000. Siyan did the Floor CR1000 and the regular fieldwork. She also did midday water potential. I remove one of the two remaining wind profile booms for use in the Delta. |
Field Data
No tank data
Well Depth
| Date | Location | Depth (feet) |
|---|---|---|
| 2016-07-07 | TZ_floor | 24.5 |
| 2016-07-07 | TZ_road | 34 |
| 2016-07-07 | TZ_tower | 28.9 |
mode = both
Moisture Point Probes TZ
Array
(
[0] => Tower_1
[1] => Floor_South_1
[2] => Floor_West_1
[3] => SoilCO2_1
[4] => Soil_Transect_4_1
[5] => Soil_Transect_3_1
[6] => Soil_Transect_2_1
[7] => Soil_Transect_1_1
[8] => SoilCO2_West_A_1
[9] => SoilCO2_West_B_1
[10] => SoilCO2_West_C_1
[11] => Tower_2
[12] => Floor_South_2
[13] => Floor_East_2
[14] => Floor_West_2
[15] => SoilCO2_2
[16] => Soil_Transect_4_2
[17] => Soil_Transect_3_2
[18] => Soil_Transect_2_2
[19] => Soil_Transect_1_2
[20] => SoilCO2_West_A_2
[21] => SoilCO2_West_B_2
[22] => SoilCO2_West_C_2
[23] => Tower_3
[24] => Floor_South_3
[25] => Floor_East_3
[26] => Floor_West_3
[27] => SoilCO2_3
[28] => Soil_Transect_4_3
[29] => Soil_Transect_3_3
[30] => Soil_Transect_2_3
[31] => Soil_Transect_1_3
[32] => SoilCO2_West_A_3
[33] => SoilCO2_West_B_3
[34] => SoilCO2_West_C_3
[35] => Tower_4
[36] => Floor_South_4
[37] => Floor_East_4
[38] => Floor_West_4
[39] => SoilCO2_4
[40] => Soil_Transect_4_4
[41] => Soil_Transect_3_4
[42] => Soil_Transect_2_4
[43] => Soil_Transect_1_4
[44] => SoilCO2_West_A_4
[45] => SoilCO2_West_B_4
[46] => SoilCO2_West_C_4
)
| Date | DOY | Rep | Depth | Tower_1 |
Floor_South_1 |
Floor_West_1 |
SoilCO2_1 |
Soil_Transect_4_1 |
Soil_Transect_3_1 |
Soil_Transect_2_1 |
Soil_Transect_1_1 |
SoilCO2_West_A_1 |
SoilCO2_West_B_1 |
SoilCO2_West_C_1 |
Tower_2 |
Floor_South_2 |
Floor_East_2 |
Floor_West_2 |
SoilCO2_2 |
Soil_Transect_4_2 |
Soil_Transect_3_2 |
Soil_Transect_2_2 |
Soil_Transect_1_2 |
SoilCO2_West_A_2 |
SoilCO2_West_B_2 |
SoilCO2_West_C_2 |
Tower_3 |
Floor_South_3 |
Floor_East_3 |
Floor_West_3 |
SoilCO2_3 |
Soil_Transect_4_3 |
Soil_Transect_3_3 |
Soil_Transect_2_3 |
Soil_Transect_1_3 |
SoilCO2_West_A_3 |
SoilCO2_West_B_3 |
SoilCO2_West_C_3 |
Tower_4 |
Floor_South_4 |
Floor_East_4 |
Floor_West_4 |
SoilCO2_4 |
Soil_Transect_4_4 |
Soil_Transect_3_4 |
Soil_Transect_2_4 |
Soil_Transect_1_4 |
SoilCO2_West_A_4 |
SoilCO2_West_B_4 |
SoilCO2_West_C_4 |
Avg | Spacial Count |
Measurement Count |
|---|---|---|---|---|---|---|---|---|---|---|---|---|---|---|---|---|---|---|---|---|---|---|---|---|---|---|---|---|---|---|---|---|---|---|---|---|---|---|---|---|---|---|---|---|---|---|---|---|---|---|---|---|---|
| 2016-07-07 | 189 | 0 | nan | 5.9 | 5 | 9.4 | 2.1 | 11.1 | 1.8 | 3.9 | 6.5 | 1.5 | 1.2 | 3.3 | 11.2 | 5.7 | 12.4 | 1.7 | 10 | 8.1 | 15.2 | 12.1 | 4.5 | 8.7 | 0.5 | 12.7 | 16.8 | 9 | 14.9 | 13.7 | 22.8 | 10.9 | 16.8 | 17 | 14.3 | 17.6 | 17.3 | 10.1 | 11.3 | 3.6 | 18.8 | 11.1 | 11.1 | 12.5 | 19.9 | 24.5 | 11.8 | 18.8 | 17.9 | 11.1 | |||
| 2016-07-07 | 189 | 1 | nan | 6.2 | 5 | 10.3 | 8.6 | 11.1 | 3.9 | 4.7 | 7.1 | 1.2 | 2.7 | 3 | 10.9 | 10.3 | 12.4 | 1.7 | 7.5 | 8.7 | 15.5 | 12.7 | 4.8 | 9.7 | 12.4 | 17.3 | 9 | 14.8 | 14 | 22.9 | 10.3 | 16.8 | 16.8 | 14.3 | 18.2 | 17.6 | 8.7 | 11.3 | 4.7 | 18.8 | 11.1 | 1.1 | 12.2 | 20.8 | 24.2 | 11.3 | 19.1 | 18.2 | 11.1 | ||||
| 2016-07-07 | 189 | Avg | 0-15cm | 0 | 0 | ||||||||||||||||||||||||||||||||||||||||||||||||
| 2016-07-07 | 189 | Avg | 15-30cm | 0 | 0 | ||||||||||||||||||||||||||||||||||||||||||||||||
| 2016-07-07 | 189 | Avg | 30-45cm | 0 | 0 | ||||||||||||||||||||||||||||||||||||||||||||||||
| 2016-07-07 | 189 | Avg | 45-60cm | 0 | 0 |
mode = both
Moisture Point Probes VR
Array
(
[0] => Solar_Panels_1
[1] => Flux_Tower_1
[2] => Gate_1
[3] => Biomass_Cage_1
[4] => Solar_Panels_2
[5] => Flux_Tower_2
[6] => Gate_2
[7] => Biomass_Cage_2
[8] => Solar_Panels_3
[9] => Flux_Tower_3
[10] => Gate_3
[11] => Biomass_Cage_3
[12] => Solar_Panels_4
[13] => Flux_Tower_4
[14] => Gate_4
[15] => Biomass_Cage_4
)
| Date | DOY | Rep | Depth | Solar_Panels_1 |
Flux_Tower_1 |
Gate_1 |
Biomass_Cage_1 |
Solar_Panels_2 |
Flux_Tower_2 |
Gate_2 |
Biomass_Cage_2 |
Solar_Panels_3 |
Flux_Tower_3 |
Gate_3 |
Biomass_Cage_3 |
Solar_Panels_4 |
Flux_Tower_4 |
Gate_4 |
Biomass_Cage_4 |
Avg | Spacial Count |
Measurement Count |
|---|---|---|---|---|---|---|---|---|---|---|---|---|---|---|---|---|---|---|---|---|---|---|
| 2016-07-07 | 189 | 0 | nan | 0.6 | 0.9 | 2.4 | 0.4 | 9.3 | 6.8 | 7.2 | 4.5 | 14.3 | 5.3 | 10.1 | 11.7 | 26.2 | 14.2 | 11.3 | 15.9 | |||
| 2016-07-07 | 189 | 1 | nan | 0.6 | 0.9 | 2.1 | 0.4 | 9.7 | 6.9 | 6.9 | 4.5 | 14.3 | 4.2 | 10.3 | 12.9 | 26.5 | 14.9 | 11.6 | 15.6 | |||
| 2016-07-07 | 189 | Avg | 0-15cm | 0 | 0 | |||||||||||||||||
| 2016-07-07 | 189 | Avg | 15-30cm | 0 | 0 | |||||||||||||||||
| 2016-07-07 | 189 | Avg | 30-45cm | 0 | 0 | |||||||||||||||||
| 2016-07-07 | 189 | Avg | 45-60cm | 0 | 0 |
No TZ grass heigth found
No VR grass heigth found
Tree DBH
| Date | Tag# | Reading (mm) |
|---|---|---|
| 2016-07-07 | 1 | 23.4 |
| 2016-07-07 | 102 | 19.7 |
| 2016-07-07 | 2 | 18.7 |
| 2016-07-07 | 245 | 22.9 |
| 2016-07-07 | 3 | 21.9 |
| 2016-07-07 | 4 | 16.5 |
| 2016-07-07 | 5 | 18.5 |
| 2016-07-07 | 7 | 15.5 |
| 2016-07-07 | 72 | 23.4 |
| 2016-07-07 | 79 | 23.2 |
| 2016-07-07 | 8 | 18.9 |
No water potential data found
No TZ Grass Biomass data found
No TZ OakLeaves Biomass data found
No TZ PineNeedles Biomass data found
2 photos found
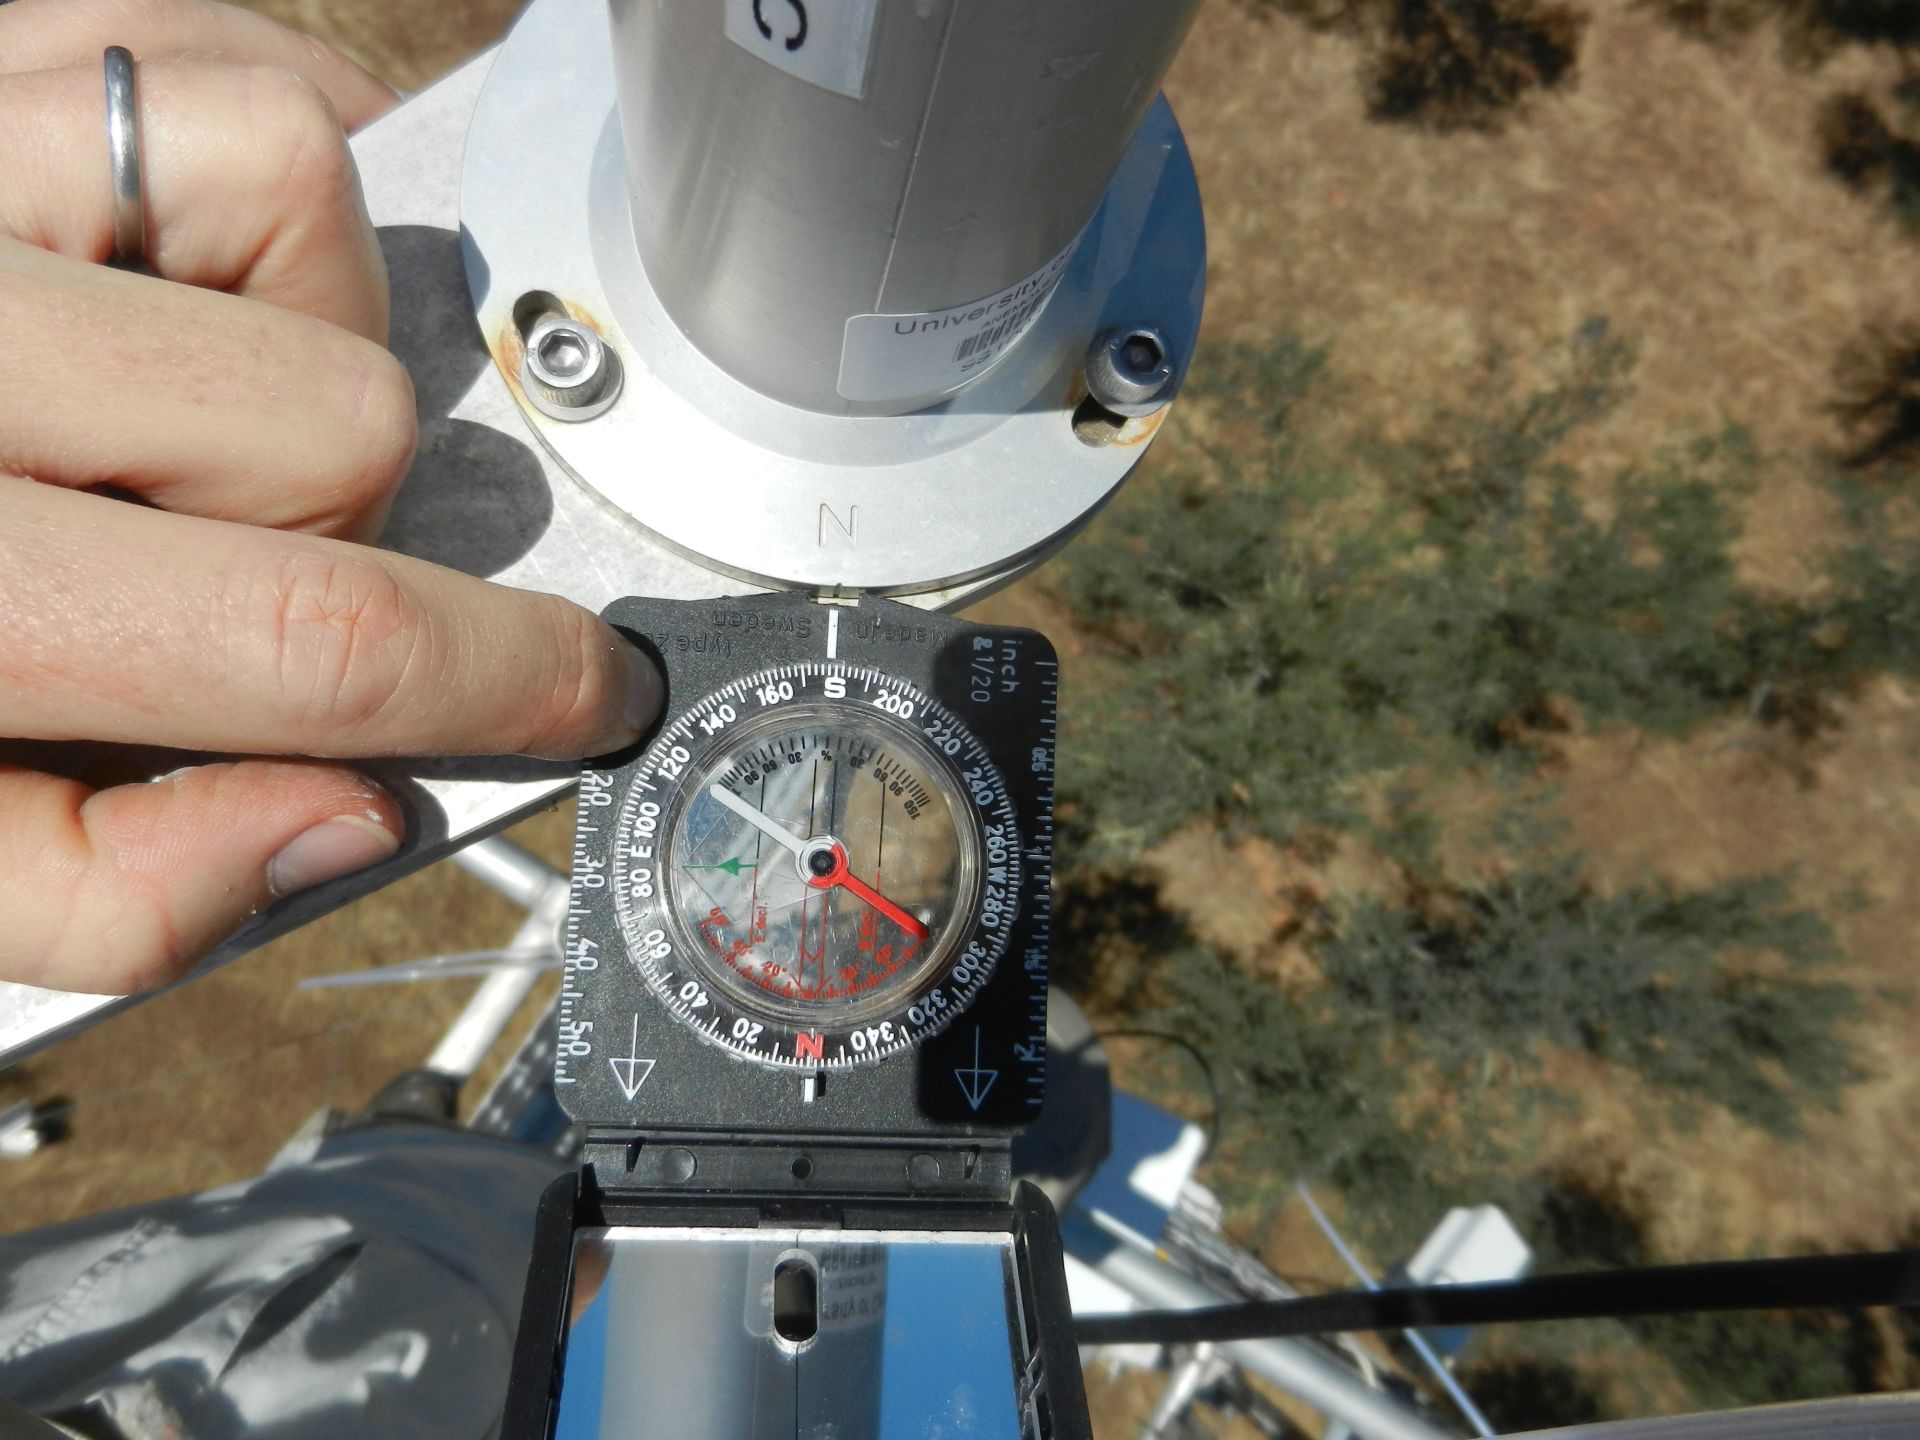
20160707TZ_TowerSonicHeading_tn.jpg ( 2016-07-07 12:40:10 ) Full size: 1920x1440
Sonic heading is 74 degrees (east) from true north
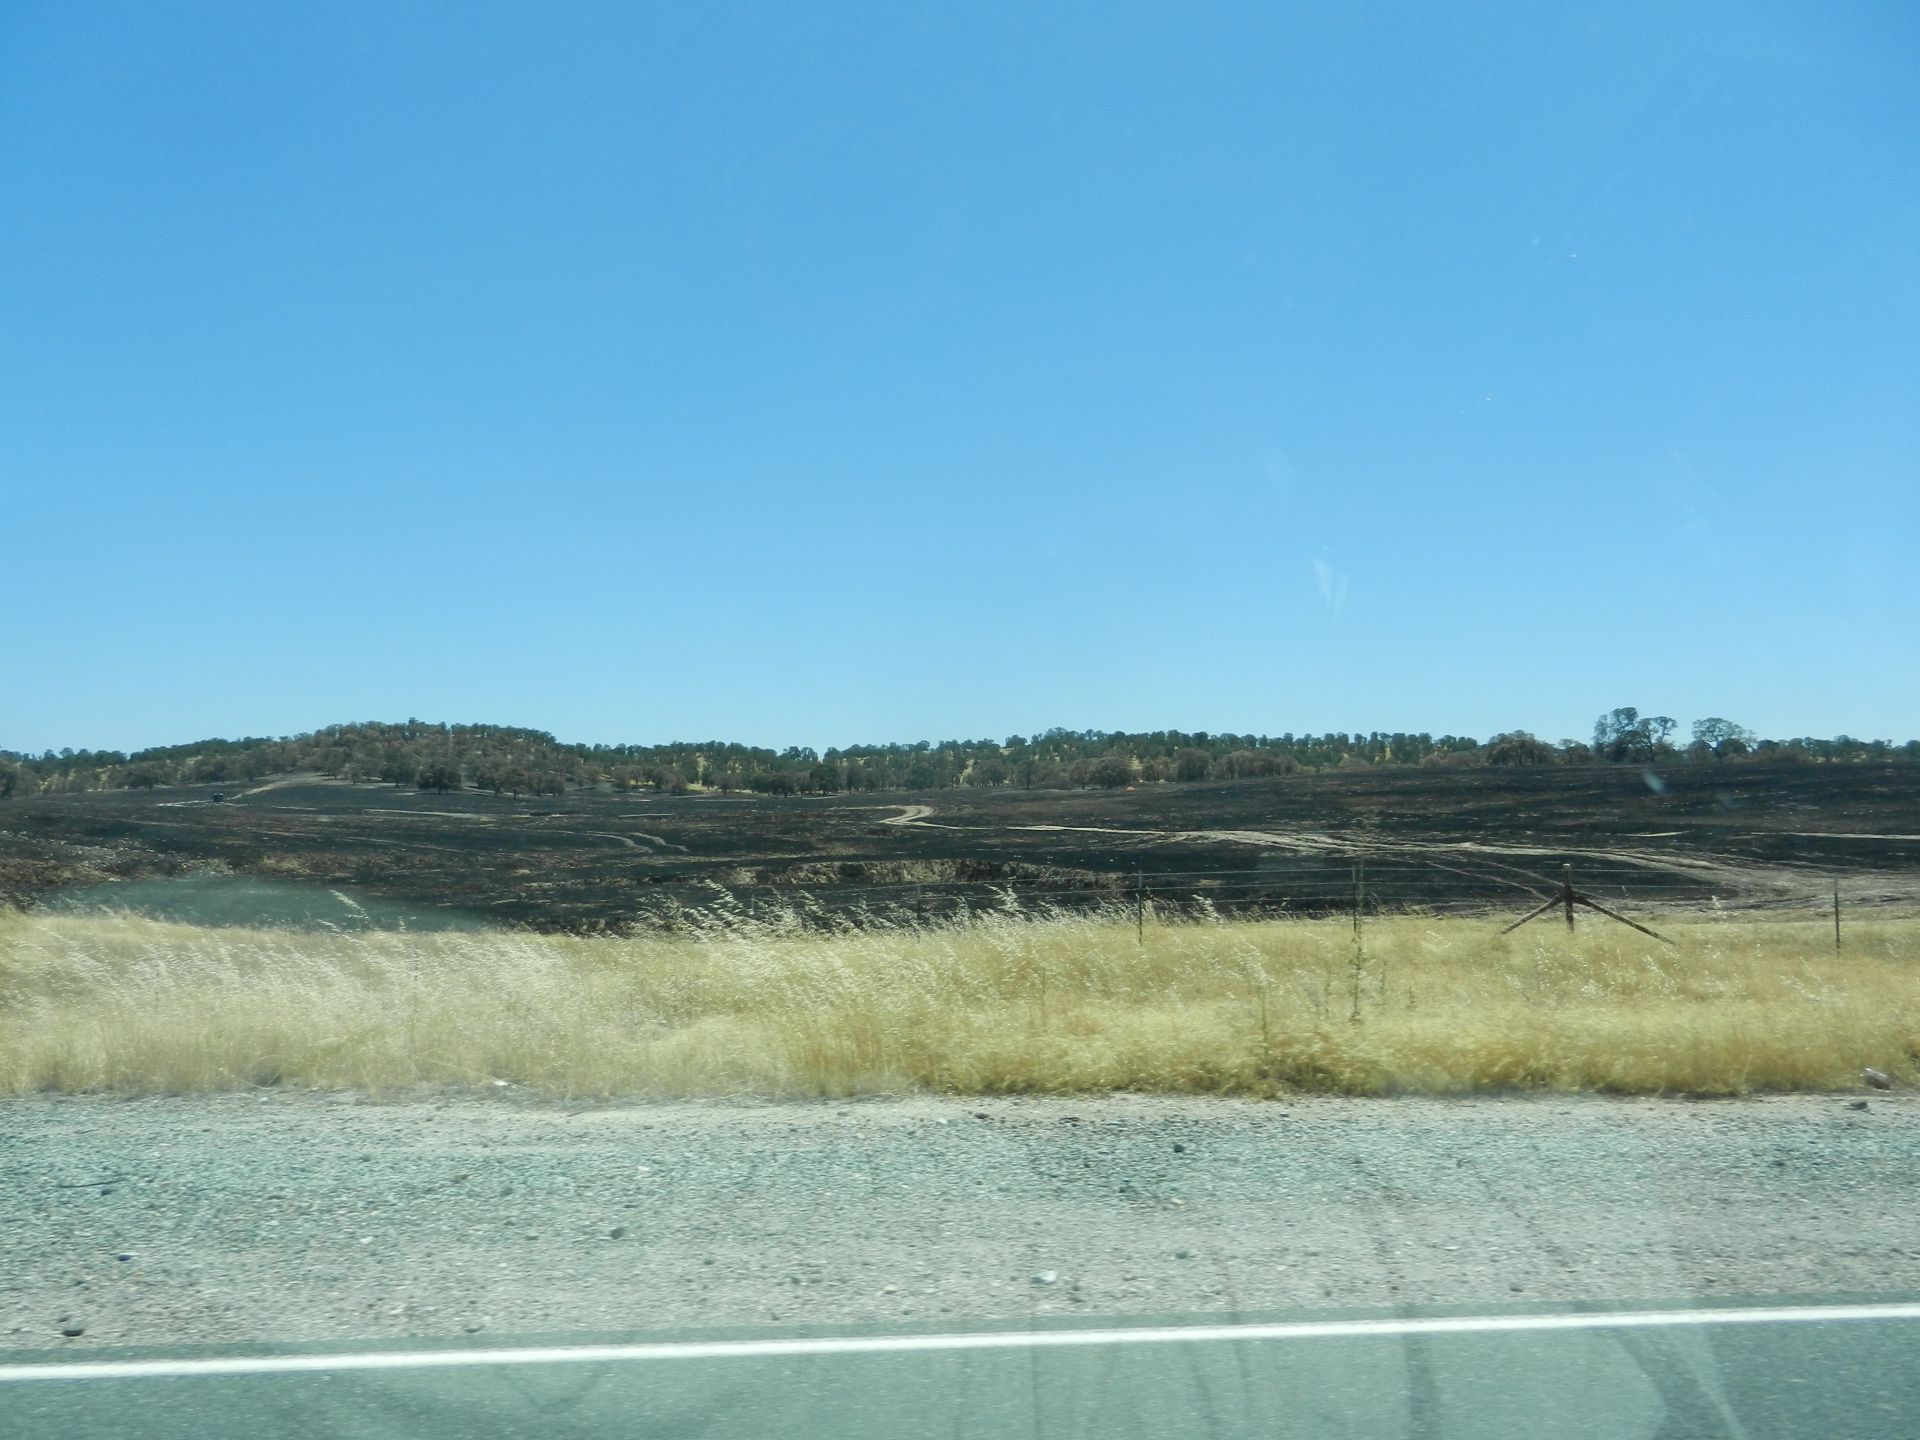
20160707TZ_TwinCitiesBurn_tn.jpg ( 2016-07-07 13:50:12 ) Full size: 1920x1440
There has been a relatively large fire along the south side Twin Cities Rd burning the cow pastures west of the quarry.
16 sets found
No data found for TZ_Fenergy.
11 TZ_tmet graphs found
11 TZ_soilco2 graphs found
Can't check TZ_mixed
3 TZ_mixed graphs found
1 TZ_fflux graphs found
8 TZ_fmet graphs found
No data found for TZ_tram.
3 TZ_co2prof graphs found
1 TZ_irt graphs found
No data found for TZ_windprof.
1 TZ_tflux graphs found
2 TZ_sm graphs found
Can't check TZ_met
1 TZ_met graphs found
Can't check TZVR_mixed
No data found for TZ_osu.
No data found for TZ_fd.
Tonzi Z-cam data