
Field Notes
<--2016-02-11 11:00:00 | 2016-03-08 10:46:00-->Other sites visited today: Twitchell Rice | West Pond | Twitchell Alfalfa | Mayberry
Phenocam link: Searching...
East End: 2016-02-25 10:30:00 (DOY 56)
Author: Elke Eichelmann
Others: Joe Verfaillie
Summary: Data collected. Checked sonic boom angle. Replaced faulty sonic cable.
| Arrived around 10:30am. Lots of cattail fluff everywhere. Green cattails are starting to come up between the dead biomass, approximately 30 to 50cm tall. There is new gravel on the road and there were some orange markers in the pond across the road from our tower. Collected USB drive GHG data, collected met data data from CR1000, collected camera pictures Checked the sonic boom direction: The Sonic north is facing approximately 332 degrees from magnetic north. LI7500 readings: CO2: 439.3, H2O: 548.8, SS: 99.5, T: 18.6, P: 102.1; after cleaning SS: 101.4 LI7700 readings: CH4: 2.33, RSSI approximately 17 -> 87 after cleaning This site has had some issues with the U wind component recorded by the sonic. We checked all the settings in the Licor datalogger but could not find any problems there. We swapped the cable from the Licor datalogger to the sonic to see if that makes a difference. We had a light breeze from the north at that time. Before the swap with the old cable U recorded approximately 0.7 to 1 m/s. After the swap with the new cable U recorded -2.7. There was no change in the observed V component. The new U makes more sense as the sonic U is facing north into the wind and we had a north wind blowing, it should be negative. Hopefully that solved the problem. Brought the old cable home for inspection. Filled LI7700 cleaning water reservoir. |
2 photos found
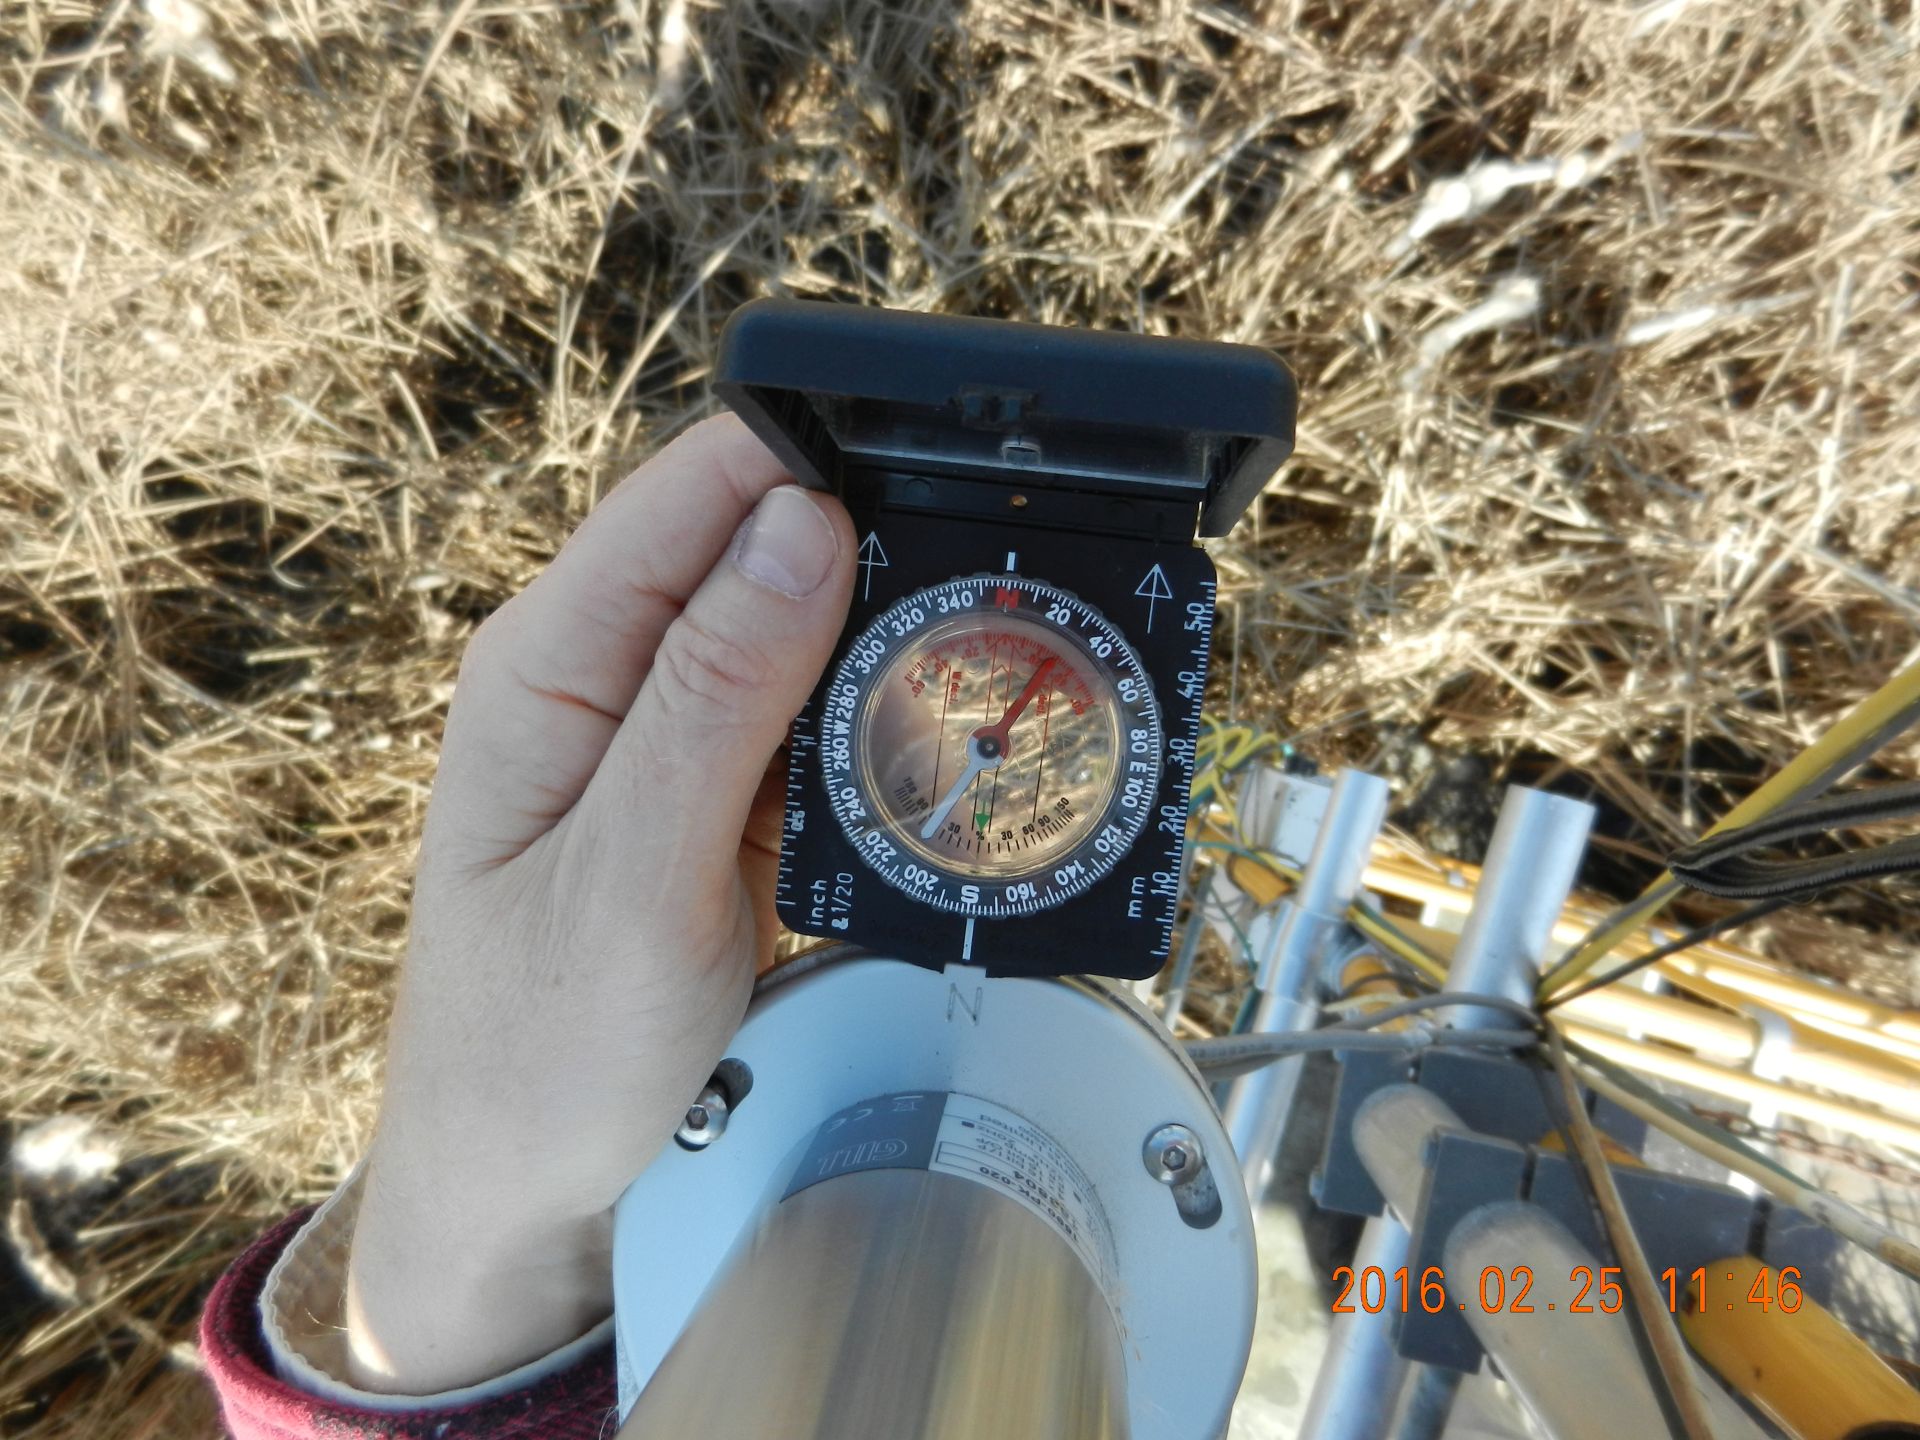
20160225EE_SonicHeading_tn.jpg ( 2016-02-25 11:46:42 ) Full size: 1920x1440
Compass showing sonic heading

20160225EE_CattailFluff_tn.jpg ( 2016-02-25 11:50:07 ) Full size: 1920x1440
Spider webs on sonic and CH4 analyzer
11 sets found
14 EE_met graphs found
Can't check EE_mixed
1 EE_mixed graphs found
8 EE_flux graphs found
Can't check MBWPEESWGT_mixed
1 EE_cam graphs found
Can't check MBEEWPSWEPGT_cam
Can't check SIMBTWEE_met
Can't check EE_Temp
5 EE_Temp graphs found
Can't check EE_minidot
1 EE_minidot graphs found
Can't check MBSWEEWPBCBA
1 EE_processed graphs found