Field Notes

<--2008-01-08 11:30:00 | 2008-02-14 11:30:00-->
Phenocam link: Searching...

Sherman Island: 2008-01-29 12:00:00 (DOY 29)
Author: Dennis Baldocchi
Others: Matteo Detto & Ben

Summary: Check and download data at Sherman Island; download data from laser and calibrate.

Sherman Island - Methane Study

Date 29 jan 2008

Day 29

Standard Time 12:00 in: Out:

Who: MD, DB, Ben

Weather: overcast windy

Phenology: patches of green grass

Tasks

  1. check and download data at Sherman Island
  2. download data from laser and calibrate

Check list

  1. Fence and gate power: OK
  2. Datalogger Solar Panel and Batteries: 10.71
  3. Reading from Gillsonic (H2O and CO2 should be in the range of 0 – 5 v.)
Time Path/File D:\Data\SI07 .raw mean std mean std w 0.2 Ts 10.0 u -4.6 H2O 1.11 v -2.5 CO2 1.84 CH4 2.06
  1. Methane Sensor (type Scroll Scroll 2)

Methane Hi-flow ppm

2.073

Cell Pressure – near 159

105/ 147 –after chance filter

Cell Temperature

15.34

Mirror time

16.2

Sample rate

10 Hz

Methane low flow put back in high flow !

Pump status

Filter Status

Water traps

  1. If Swapping Li-7500 Analyzer. (Remove SN# ; install SN# )
  2. Check the fans of air temp. and relative humidity sensors
  3. Check MD-9 system connections
  4. Check CR23X with two multiplexers and sensor values
  5. Check levels of Radiation sensors, clear up surfaces.

Closed gate and set up fence.

Other Notes:

Water table 2.7 feet above the well

Remember next time to:

2 photos found

People in the field
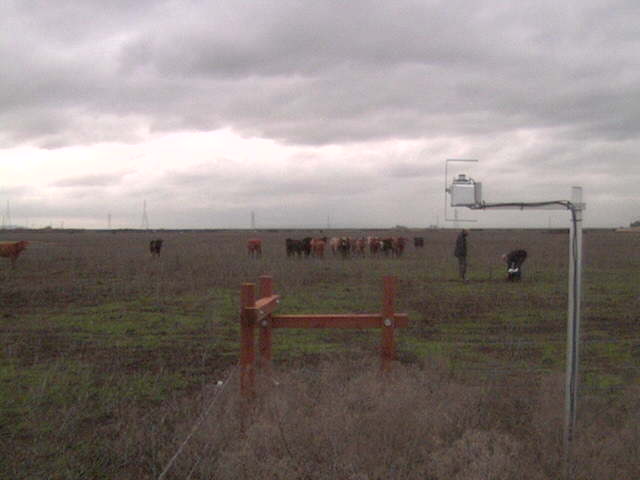
SI_webcam_2008029_1336.jpg ( 2008-01-29 13:36:22 ) Full size: 640x480
People in the field

Bird on the fence
SI_webcam_2008030_1106.jpg ( 2008-01-30 11:06:06 ) Full size: 640x480
Bird on the fence

Graphs display:
7 sets found

No data found for SI_mp.
10 SI_met graphs found

Explore the graph:Solar Radiation in a new window

Explore the graph:Energy in a new window

Explore the graph:Soil Temperatures Set 1 in a new window

Explore the graph:Soil Temperatures Set 2 in a new window

Explore the graph:Soil Temperatures Set 3 in a new window

Explore the graph:Soil Temperature at -16cm in a new window

Explore the graph:Solar Radiation from CNR1 in a new window

Explore the graph:Sherman Island Rain in a new window

Explore the graph:Sherman Well Level in a new window

Explore the graph:Box Temperatures in a new window

Can't check SI_mixed
2 SI_mixed graphs found

Explore the graph:Theta Probes in a new window

Explore the graph:Sherman Island Air Temperatures in a new window

4 SI_flx graphs found

Explore the graph:Sonic Wind in a new window

Explore the graph:CH4 Concentrations in a new window

Explore the graph:Sample Counts in a new window

Explore the graph:LI7500 CO2 and H2O in a new window

No data found for SI_soilco2.
Can't check TWSI_mixed
Can't check SIMBTWEE_met