Field Notes

<--2015-09-02 12:00:00 | 2015-09-30 13:00:00-->
Other sites visited today: Mayberry | Twitchell Rice | West Pond | Twitchell Alfalfa

East End: 2015-09-16 11:00:00 (DOY 259)
Author: Patty Oikawa
Others: Dennis, Kyle, Sabina

Summary: veg starting to brown, normal site visit

We arrived at 11am. It was still overcast and there was otter poop all over the bottom of the tower. Veg turning brown. Kyle cleaned the sensors. Sabina helped with the camera and checked the reservoir. I downloaded data.

Readings:
CO2 = 375 µmol/mol
H2O = 582mmol m-3
SS=80
t = 19.9 C
p = 101.6 kPa
sos: 338 m s-1
CH4: 1.97 ppm (1.99 after cleaning)
RSSI: 64% (90 after cleaning)

Reservoir: OK
Met:OK

1 photos found

view of field site
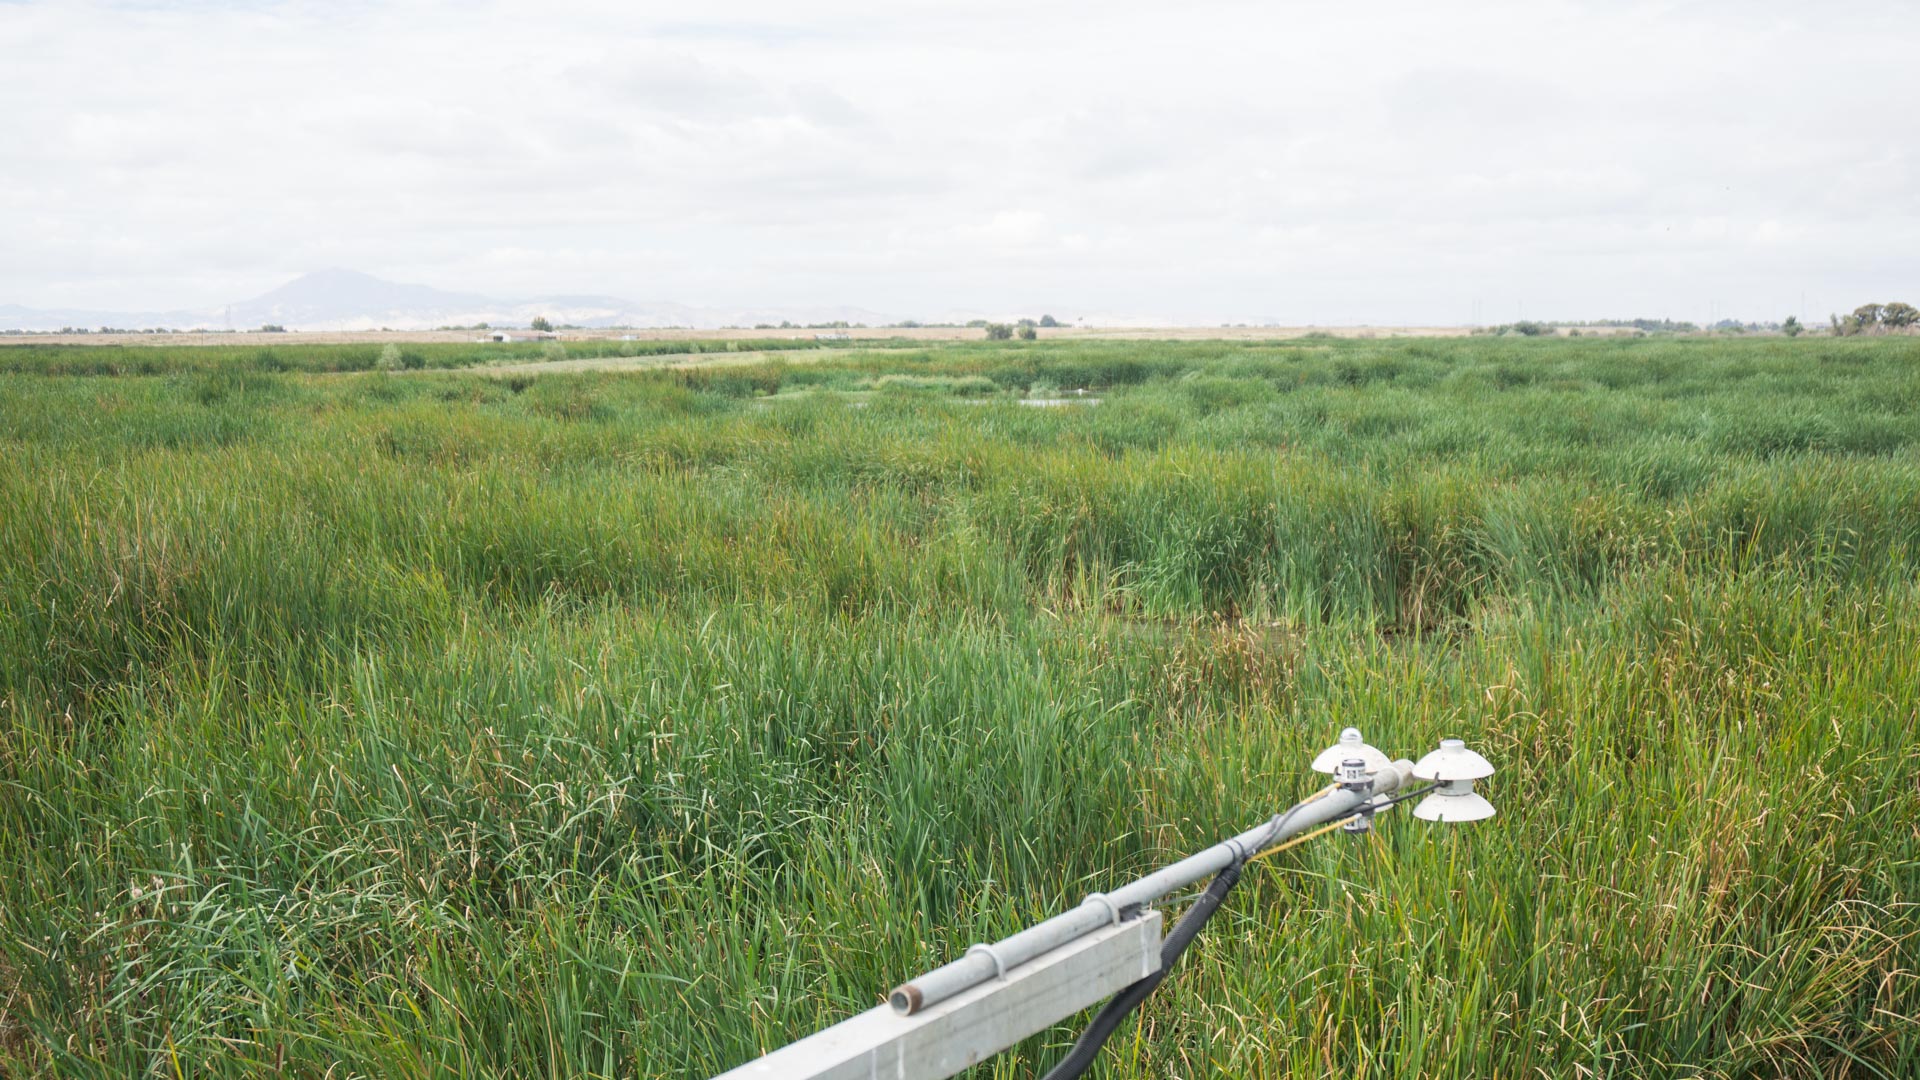
20150916EE_Site.jpg ( 2015-09-16 14:08:23 ) Full size: 1920x1080
view of field site

Graphs display:
11 sets found

14 EE_met graphs found

Explore the graph:Temperature and Batt V in a new window

Explore the graph:Soil Moisture and Well Pressure in a new window

Explore the graph:Solar Radiation in a new window

Explore the graph:PAR in a new window

Explore the graph:Soil Heat Flux in a new window

Explore the graph:Water Level and Rain in a new window

Explore the graph:Soil/Water Temperature Set 1 in a new window

Explore the graph:Soil/Water Temperature Set 2 in a new window

Explore the graph:Soil/Water Temperature Set 3 in a new window

Explore the graph:Dissolved Oxygen and Wind Speed in a new window

Explore the graph:SRS NDVI Channels in a new window

Explore the graph:Apogee NDVI in a new window

Explore the graph:NDVI in a new window

Explore the graph:Undercanopy PAR in a new window

Can't check EE_mixed
1 EE_mixed graphs found

Explore the graph:Air Pressure and RH in a new window

8 EE_flux graphs found

Explore the graph:Wind Speeds in a new window

Explore the graph:LI7500 CO2 and H2O in a new window

Explore the graph:LI7700 CH4 and RSSI in a new window

Explore the graph:Flux Counts in a new window

Explore the graph:Instument Temperatures in a new window

Explore the graph:Temp Tower 3 (Mixed Veg) in a new window

Explore the graph:Temp Tower 3 (Mixed Veg) in a new window

Explore the graph:Temp Tower 3 (Mixed Veg) in a new window

Can't check MBWPEESWGT_mixed
1 EE_cam graphs found

Explore the graph:EE Autocam GCC in a new window

Can't check MBEEWPSWEPGT_cam
Can't check SIMBTWEE_met
Can't check EE_Temp
5 EE_Temp graphs found

Explore the graph:Sonic SOS in a new window

Explore the graph:LI7500 CO2 in a new window

Explore the graph:Water Level in a new window

Explore the graph:LI-7700 CH4 in a new window

Explore the graph:Wind Speed in a new window

Can't check EE_minidot
1 EE_minidot graphs found

Explore the graph:EE miniDOT Dissolved Oxygen in a new window

Can't check MBSWEEWPBCBA
1 EE_processed graphs found

Explore the graph:CO2 Fluxes in a new window