
Field Notes
<--2015-07-20 13:30:00 | 2015-09-01 09:30:00-->Phenocam link: Searching...
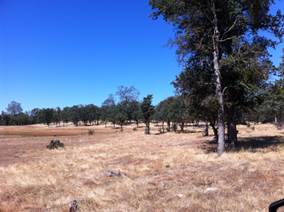
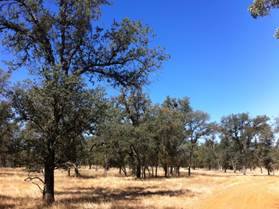
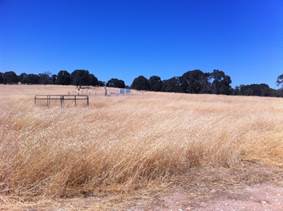
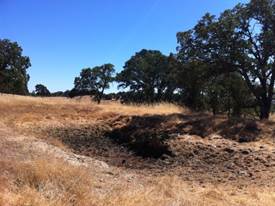
Tonzi: 2015-08-12 11:15:00 (DOY 224)
Author: Siyan Ma
Others:
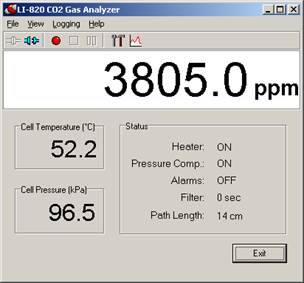
Summary: Very dry and dusty, swapped 7500 on Floor tower, tower computer hung up again, CO2 profile IRGA dirty.
|
When: Date: 8/12/2015 , Day: 241 , Watch Time: 11:15 am . Where: Tonzi/Vaira Ranch Who: Siyan Weather: clear, sunny, nice breeze Phenology: very dry and dusty, golden grassland; green oak leaves
Summary
3. Checked and downloaded data from PC at Tower, Floor, and Vaira. Tower PC was frozon when I got there. I restarted it, and then it worked well.
Vaira_Grass Site
Tonzi_Tower Site
Tower PC was frozon when I got there. I restarted it, and then it worked well.
Tank CO2 tank, 1200, 405ppm, 0, 18psi N2, almost empty, 300, 10 Is the pump running? YES, but no calibration performed at the site. The reading of IRGA went weird. Data may lost.
9. closed gate and set up fence. YES! Toniz_Floor Site
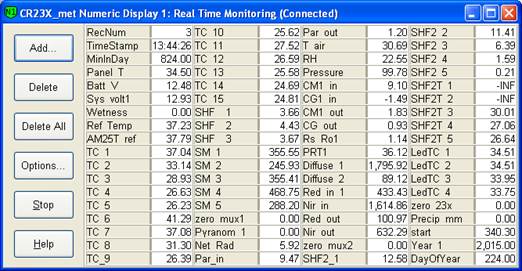
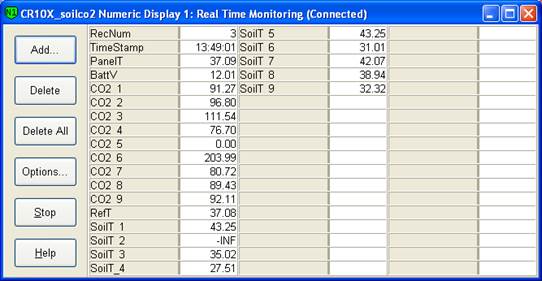
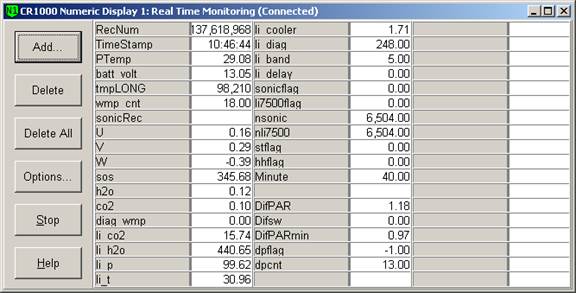
CR23X3 – floor-Met CR23X6 – tower-Met CR10X2 – floor-Met Soil CO2 profile: CR23X5 – soil CO2 profile
|
Field Data
CO2 Profile Tanks
| Date | Tank | Pressure (psi) | ppm |
|---|---|---|---|
| 2015-08-12 | CO2 | 1200 | 405 |
| 2015-08-12 | N2 | 300 | 0 |
Well Depth
| Date | Location | Depth (feet) |
|---|---|---|
| 2015-08-12 | TZ_floor | 30.1 |
| 2015-08-12 | TZ_road | 39 |
| 2015-08-12 | TZ_tower | 35.1 |
mode = both
Moisture Point Probes TZ
Array
(
[0] => Tower_1
[1] => Floor_South_1
[2] => Floor_East_1
[3] => Floor_West_1
[4] => SoilCO2_1
[5] => Soil_Transect_4_1
[6] => Soil_Transect_3_1
[7] => Soil_Transect_2_1
[8] => Soil_Transect_1_1
[9] => SoilCO2_West_A_1
[10] => SoilCO2_West_B_1
[11] => SoilCO2_West_C_1
[12] => Tower_2
[13] => Floor_South_2
[14] => Floor_East_2
[15] => Floor_West_2
[16] => SoilCO2_2
[17] => Soil_Transect_4_2
[18] => Soil_Transect_3_2
[19] => Soil_Transect_2_2
[20] => Soil_Transect_1_2
[21] => SoilCO2_West_A_2
[22] => SoilCO2_West_B_2
[23] => SoilCO2_West_C_2
[24] => Tower_3
[25] => Floor_South_3
[26] => Floor_East_3
[27] => Floor_West_3
[28] => SoilCO2_3
[29] => Soil_Transect_4_3
[30] => Soil_Transect_3_3
[31] => Soil_Transect_2_3
[32] => Soil_Transect_1_3
[33] => SoilCO2_West_A_3
[34] => SoilCO2_West_B_3
[35] => SoilCO2_West_C_3
[36] => Tower_4
[37] => Floor_South_4
[38] => Floor_East_4
[39] => Floor_West_4
[40] => SoilCO2_4
[41] => Soil_Transect_4_4
[42] => Soil_Transect_3_4
[43] => Soil_Transect_2_4
[44] => Soil_Transect_1_4
[45] => SoilCO2_West_A_4
[46] => SoilCO2_West_B_4
[47] => SoilCO2_West_C_4
)
| Date | DOY | Rep | Depth | Tower_1 |
Floor_South_1 |
Floor_East_1 |
Floor_West_1 |
SoilCO2_1 |
Soil_Transect_4_1 |
Soil_Transect_3_1 |
Soil_Transect_2_1 |
Soil_Transect_1_1 |
SoilCO2_West_A_1 |
SoilCO2_West_B_1 |
SoilCO2_West_C_1 |
Tower_2 |
Floor_South_2 |
Floor_East_2 |
Floor_West_2 |
SoilCO2_2 |
Soil_Transect_4_2 |
Soil_Transect_3_2 |
Soil_Transect_2_2 |
Soil_Transect_1_2 |
SoilCO2_West_A_2 |
SoilCO2_West_B_2 |
SoilCO2_West_C_2 |
Tower_3 |
Floor_South_3 |
Floor_East_3 |
Floor_West_3 |
SoilCO2_3 |
Soil_Transect_4_3 |
Soil_Transect_3_3 |
Soil_Transect_2_3 |
Soil_Transect_1_3 |
SoilCO2_West_A_3 |
SoilCO2_West_B_3 |
SoilCO2_West_C_3 |
Tower_4 |
Floor_South_4 |
Floor_East_4 |
Floor_West_4 |
SoilCO2_4 |
Soil_Transect_4_4 |
Soil_Transect_3_4 |
Soil_Transect_2_4 |
Soil_Transect_1_4 |
SoilCO2_West_A_4 |
SoilCO2_West_B_4 |
SoilCO2_West_C_4 |
Avg | Spacial Count |
Measurement Count |
|---|---|---|---|---|---|---|---|---|---|---|---|---|---|---|---|---|---|---|---|---|---|---|---|---|---|---|---|---|---|---|---|---|---|---|---|---|---|---|---|---|---|---|---|---|---|---|---|---|---|---|---|---|---|---|
| 2015-08-12 | 224 | 0 | nan | 4.7 | 1.2 | 10 | 11.5 | 7.1 | 0.9 | 1.8 | 3.9 | 4.7 | 7.4 | 0.9 | 1.8 | 9.7 | 7.8 | 8.4 | 1.4 | 5.4 | 8.4 | 13.9 | 12.1 | 4.5 | 6 | 1.4 | 11.8 | 15.1 | 9.2 | 11.2 | 9.8 | 8.1 | 9.2 | 11.7 | 16.5 | 12.9 | 15.4 | 15.4 | 14.3 | 8.5 | 3.9 | 18.8 | 17 | 17.3 | 10.2 | 15.3 | 24.2 | 9.9 | 16.8 | 15.6 | 20.2 | |||
| 2015-08-12 | 224 | 1 | nan | 4.7 | 1.2 | 9.7 | 5.9 | 1.9 | 1.8 | 5.3 | 7.7 | 9.7 | 7.8 | 1.1 | 6.6 | 7.5 | 13.3 | 4.8 | 5.7 | 15.4 | 9 | 11.5 | 8.1 | 9.5 | 12.6 | 13.4 | 15.6 | 8.2 | 4.2 | 17.1 | 17.9 | 10.3 | 15.9 | 11 | 16.8 | |||||||||||||||||||
| 2015-08-12 | 224 | Avg | 0-15cm | 0 | 0 | |||||||||||||||||||||||||||||||||||||||||||||||||
| 2015-08-12 | 224 | Avg | 15-30cm | 0 | 0 | |||||||||||||||||||||||||||||||||||||||||||||||||
| 2015-08-12 | 224 | Avg | 30-45cm | 0 | 0 | |||||||||||||||||||||||||||||||||||||||||||||||||
| 2015-08-12 | 224 | Avg | 45-60cm | 0 | 0 |
mode = both
Moisture Point Probes VR
Array
(
[0] => Solar_Panels_1
[1] => Flux_Tower_1
[2] => Gate_1
[3] => Biomass_Cage_1
[4] => Solar_Panels_2
[5] => Flux_Tower_2
[6] => Gate_2
[7] => Biomass_Cage_2
[8] => Solar_Panels_3
[9] => Flux_Tower_3
[10] => Gate_3
[11] => Biomass_Cage_3
[12] => Solar_Panels_4
[13] => Flux_Tower_4
[14] => Gate_4
[15] => Biomass_Cage_4
)
| Date | DOY | Rep | Depth | Solar_Panels_1 |
Flux_Tower_1 |
Gate_1 |
Biomass_Cage_1 |
Solar_Panels_2 |
Flux_Tower_2 |
Gate_2 |
Biomass_Cage_2 |
Solar_Panels_3 |
Flux_Tower_3 |
Gate_3 |
Biomass_Cage_3 |
Solar_Panels_4 |
Flux_Tower_4 |
Gate_4 |
Biomass_Cage_4 |
Avg | Spacial Count |
Measurement Count |
|---|---|---|---|---|---|---|---|---|---|---|---|---|---|---|---|---|---|---|---|---|---|---|
| 2015-08-12 | 224 | 0 | nan | 3.9 | 1.5 | 3.6 | 0.3 | 12.7 | 9.3 | 6.9 | 3.2 | 16.2 | 5 | 12.3 | 13.7 | 28.5 | 13.6 | 10.7 | 16.5 | |||
| 2015-08-12 | 224 | 1 | nan | 3.6 | 1.5 | 3.3 | 0.3 | 11.8 | 9 | 7.5 | 3.9 | 16.2 | 5.6 | 12 | 13.4 | 29.1 | 14.8 | 10.9 | 16.8 | |||
| 2015-08-12 | 224 | Avg | 0-15cm | 0 | 0 | |||||||||||||||||
| 2015-08-12 | 224 | Avg | 15-30cm | 0 | 0 | |||||||||||||||||
| 2015-08-12 | 224 | Avg | 30-45cm | 0 | 0 | |||||||||||||||||
| 2015-08-12 | 224 | Avg | 45-60cm | 0 | 0 |
No TZ grass heigth found
No VR grass heigth found
Tree DBH
| Date | Tag# | Reading (mm) |
|---|---|---|
| 2015-08-12 | 102 | 11.0 |
| 2015-08-12 | 2 | 14.8 |
| 2015-08-12 | 245 | 21.8 |
| 2015-08-12 | 3 | 16.5 |
| 2015-08-12 | 4 | 10.1 |
| 2015-08-12 | 5 | 16.0 |
| 2015-08-12 | 7 | 15.9 |
| 2015-08-12 | 72 | 31.0 |
| 2015-08-12 | 79 | 17.0 |
| 2015-08-12 | 8 | 12.0 |
No water potential data found
No TZ Grass Biomass data found
No TZ OakLeaves Biomass data found
No TZ PineNeedles Biomass data found
0 photos found
16 sets found
No data found for TZ_Fenergy.
11 TZ_tmet graphs found
11 TZ_soilco2 graphs found
Can't check TZ_mixed
3 TZ_mixed graphs found
1 TZ_fflux graphs found
8 TZ_fmet graphs found
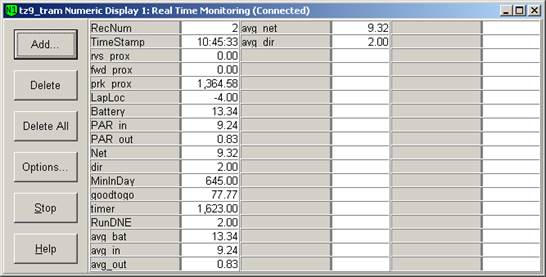
1 TZ_tram graphs found
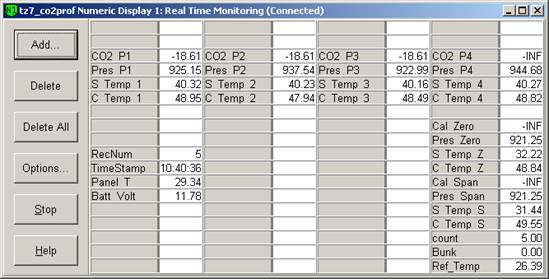
3 TZ_co2prof graphs found
1 TZ_irt graphs found
No data found for TZ_windprof.
1 TZ_tflux graphs found
2 TZ_sm graphs found
Can't check TZ_met
1 TZ_met graphs found
Can't check TZVR_mixed
8 TZ_osu graphs found
No data found for TZ_fd.
Tonzi Z-cam data