Field Notes
<--2015-01-15 11:00:00 | 2015-02-05 12:00:00-->Other sites visited today: West Pond | Sherman Island | Twitchell Alfalfa | Mayberry | Twitchell Rice
Phenocam link: Searching...
East End: 2015-01-20 09:30:00 (DOY 20)
Author: Sara Knox
Others: Joe, Patty
Summary: Reinstalled flux and instruments. Added new camera. Water level low.
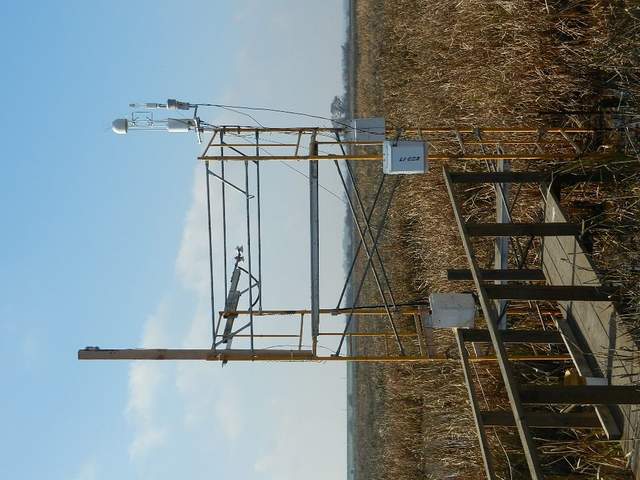
| East End Wetland 2015-01-20 We arrived around 9:30 PST. It was chilly and foggy. The water level was low. We met Bryan Brock later who said the water was low for duck hunting. Bryan also said that duck hunting is only allowed on Wednesdays and Saturdays - report to him if you see hunting on other days. We reinstalled the flux and met sensors. Joe installed his new Raspberry Pi camera. The sonic initially had the wrong settings and a reversed wire on the RS422 to RS232 converter was blocking transmission to the sonic. The wire and settings were fixed. All seemed to work fine by the time we left. Here are the new measurement heights: Flux sensors To the base of the mount: 470 cm To the middle of the LI-7500/sonic path: 535 cm To the middle of the LI-7700 path: 529 cm Well and water sensors Pressure transducer: 144 cm below the top of the well Height of well above soil surface: 56 cm Water depth: 8 cm Things we didn’t get to (already added to the to do list): Get GPS location of tower Bring bird spikes for 7500 Measure sonic N New HMP60 fan Still need to figure out where to mount the rain gauge Need to better connect grounding cable to box A new 2x4 needs to be added to the scaffolding to move the data logger box to the long (west) side of the scaffolding. The sonic cable is a little short and might be replaced. A section of railing should be added to the boardwalk. Readings before we left: CO2 = 18.3 mmol m-3 H2O = 525 mmol m-3 Sos = 339 m s-1 p = 102.2 kPa t = 16 C diag: 247 CH4: 2.56 ppm RSSI: 60% |
1 photos found

20150120EE_Reinstrumented.jpg ( 2015-01-20 14:10:33 ) Full size: 1024x768
Reinstalled the flux and met sensors on the reconstructed scaffolding
11 sets found
14 EE_met graphs found
Can't check EE_mixed
1 EE_mixed graphs found
8 EE_flux graphs found
Can't check MBWPEESWGT_mixed
No data found for EE_cam.
Can't check MBEEWPSWEPGT_cam
Can't check SIMBTWEE_met
Can't check EE_Temp
5 EE_Temp graphs found
Can't check EE_minidot
1 EE_minidot graphs found
Can't check MBSWEEWPBCBA
1 EE_processed graphs found

