
Field Notes
<--2008-11-26 10:00:00 | 2009-01-08 10:00:00-->Other sites visited today: Vaira
Phenocam link: Searching...
Tonzi: 2008-12-11 12:00:00 (DOY 346)
Author: Joe Verfaillie
Others: Hideki
Summary: Showing Hideki the site, Standard field work, check Floor batteries, wind profile removed
|
12/11/2008 (346) Tonzi Joe and Hideki arrived about 12:00pm. Climbed tower to show Hideki and check on removing wind profile system. Hideki made soil moisture measurements. Joe made spectrum measurements and collected grass sample to the east of the tower. Spectrum measurements done about 2:30pm in sunny patches to the east of the Tower. Integration time 275ms. Three rep in three locations. Location height files 1 ~100cm (not recoded) tz_1_1 to tz_1_3 2 102cm tz_2_1 to tz_2_3 3 98cm tz_3_1 to tz_3_3 Phenology: maybe 5 to 10% leaves on trees mostly brown. Ground tinged with green, cm or two new grass dew in shady areas even at noon. Tower: Fence in yellow, system tested fine when not connected to fence. Walked fence and found to wire touching fence post in one location. Fixed – full power when we left. Batteries: 13.4V Load: 4.6 Amps
Data checked and downloaded Fan on to HMP45 not working Rain gage clear little bit of water in tipping bucket Radiation sensor dirty, especially pyranometer – cleaned about 3pm Bird protection on sonic kind of sideways – lowered, straightened, raised about 3pm Gas cylinders: CO2 700 psig; flow 22 psi N2 1800 psig; flow 22 psi Did manual zero of CO2 profile system. Started to do span but didn’t see how to tell the LI800 what the concentration of the span gas is so did not span. When flow the span gas (431.80ppm) the LI800 read 428ppm. MD9 connections X13 – okay – data file is 75MB – usual or needs attention‌ X15 – okay X11 – okay X10 – okay CR10X7 – okay Pump running – yes Hideki removed wind profile system. Mounting arms left in place. Power cable for 10x disconnected in power box and left on tower. Gate closed and power up Floor: System was running, no problems with power even with screen and usb hard drive. I disconnected all the batteries and ran the system on a single spare battery while I let the batteries rest. After resting, all batteries tested good in voltage and under load. Reconnected all batteries and torqued connections with wrench. Fence: +12V Batteries: 12.9V Panels: 19.6Amps Load: 3.3Amps with screen and USB drive
Data downloaded and checked MD9 connections: CR23X3 – floor-Met - okay CR23X5 – soil CO2 profile - okay CR23X6 – tower-Met - okay CR10X2 – floor-Met - okay CR10X4 – sap-flow - failed CR10X8 – wind profile - removed Fence closed and powered. Soil CO2 site: Door on tree instrument box ajar. Under tree charge controller batteries: 28.4V, panels 1.3 amps, load 0.0amps Reading from data logger
Reading from panels of analyzers
Mr. Tonzi’s ATV is in the shop because it won’t go into reverse and a Forestry officer returned to him and sign from when he used to drive cows up into the mountains to graze. It is now mounted near his house “Tonzi Cow Camp ->â€. | ||||||||||||||||||||||||||||||||||||||||||||||||||||||||||||||||||||||||||||||||||||||||||||||||||||||||||||||||||||||||||||||||||||||||||||||||||||||
Field Data
No tank data
No TZ Well data found
No TZ Moisture Point data found
No VR Moisture Point data found
No TZ grass heigth found
No VR grass heigth found
No TZ Tree DBH found
No water potential data found
No TZ Grass Biomass data found
No TZ OakLeaves Biomass data found
No TZ PineNeedles Biomass data found
7 photos found
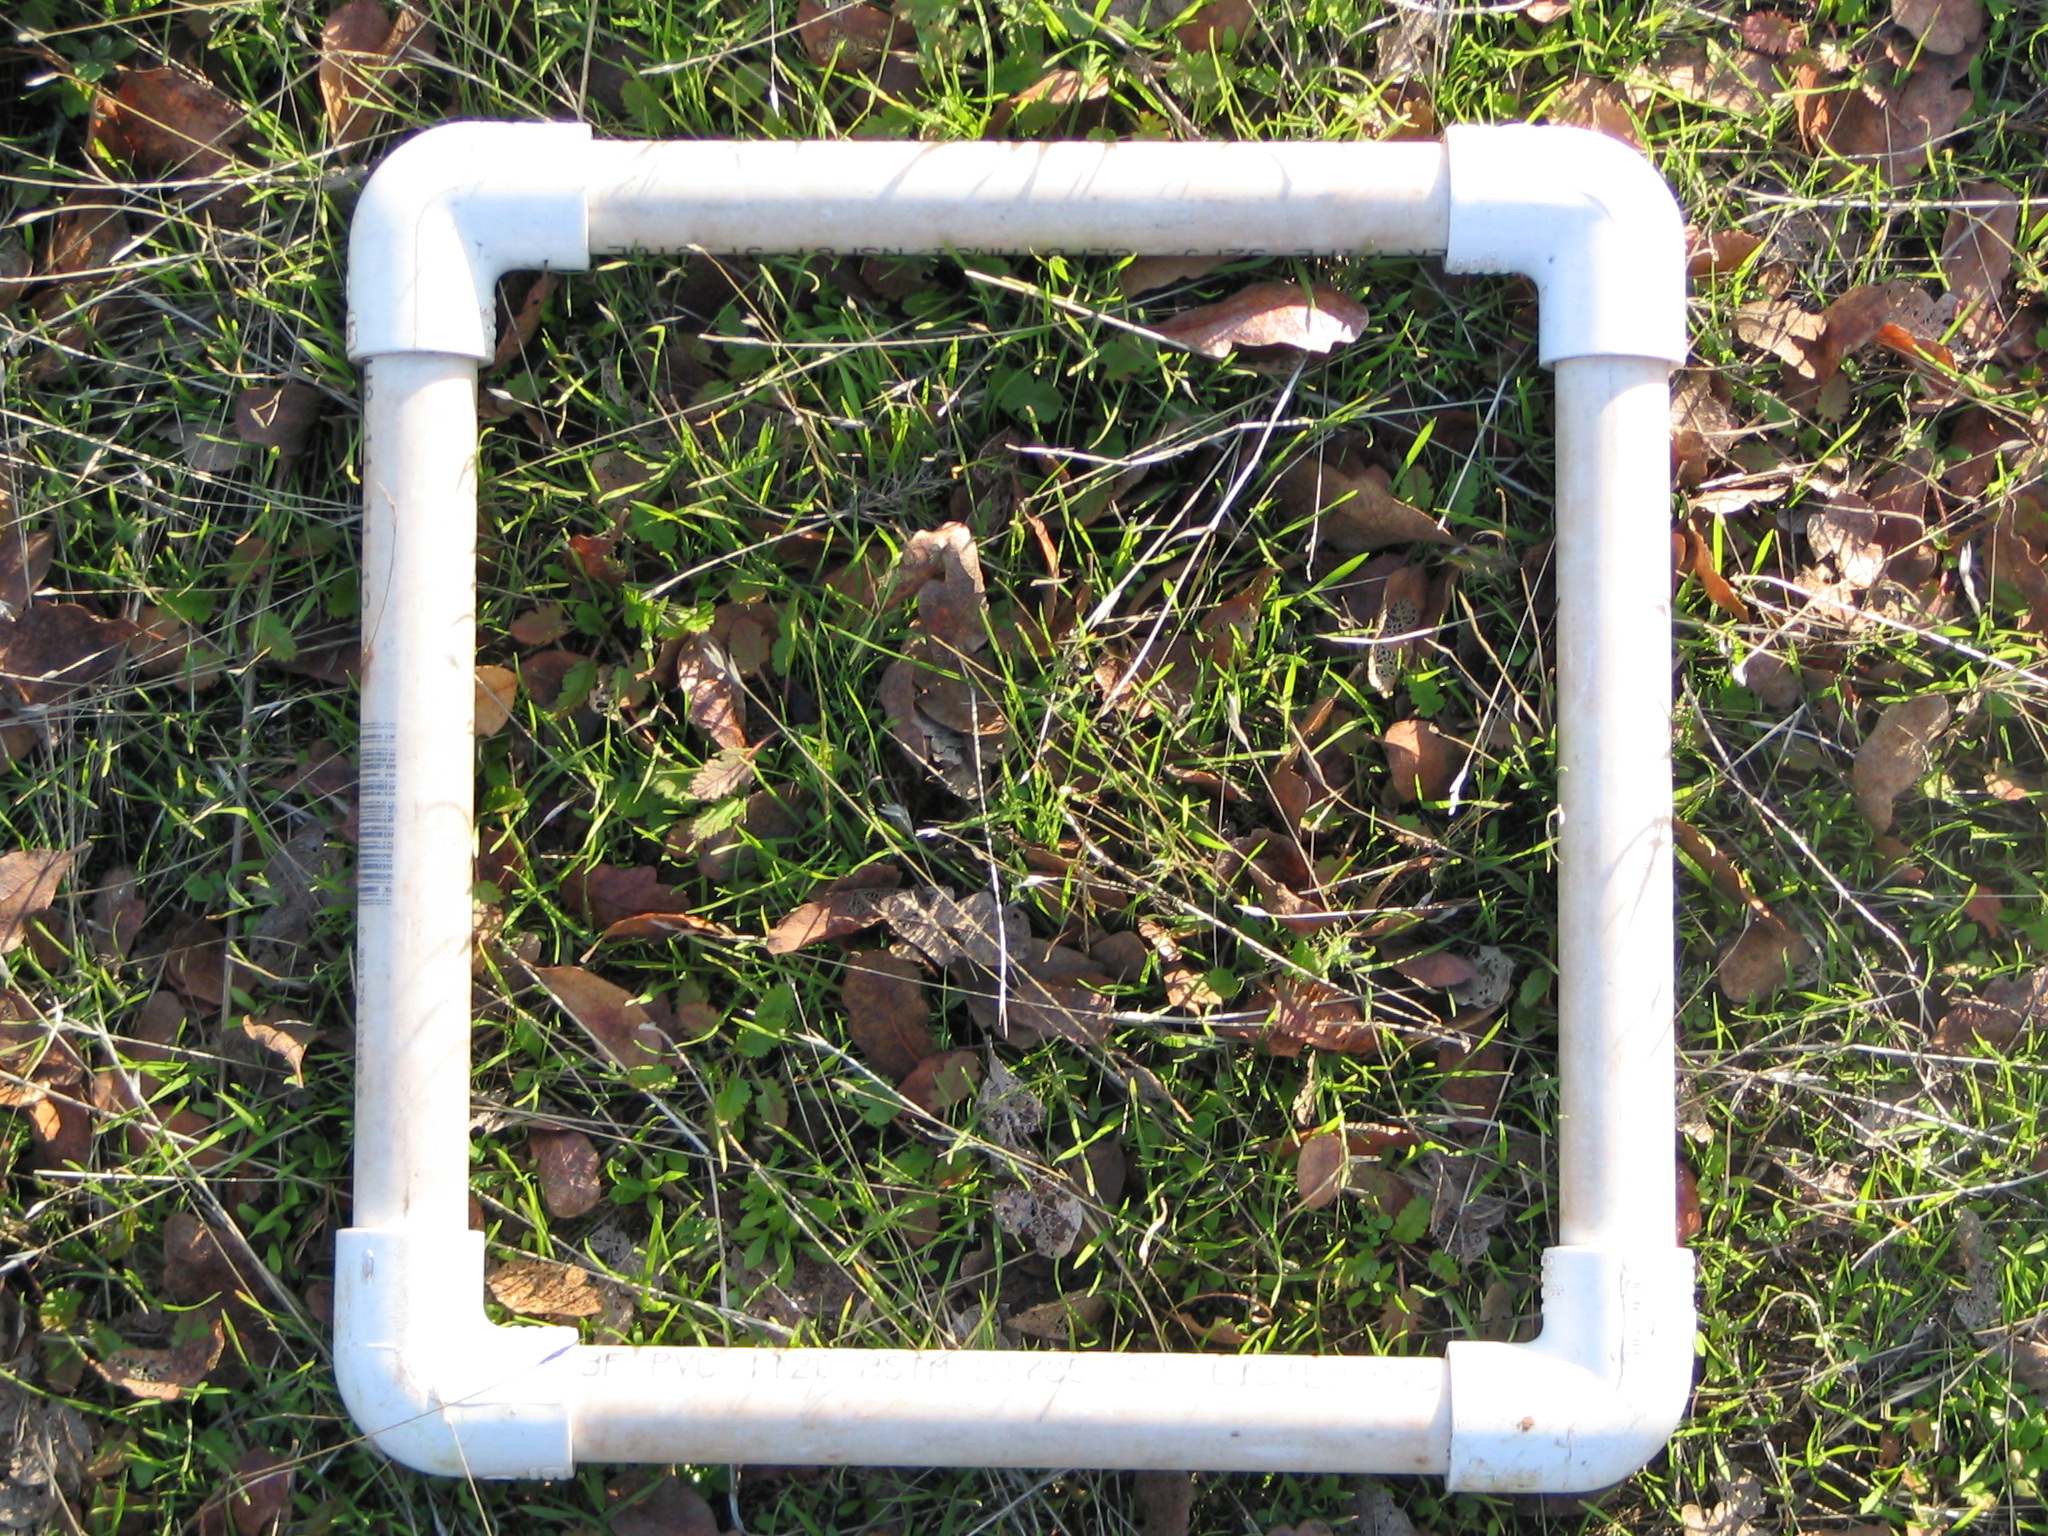
20081211TZ_BoimassSampleBefore.jpg ( 2008-12-11 15:13:51 ) Full size: 2048x1536
Biomass clip plot before harvesting
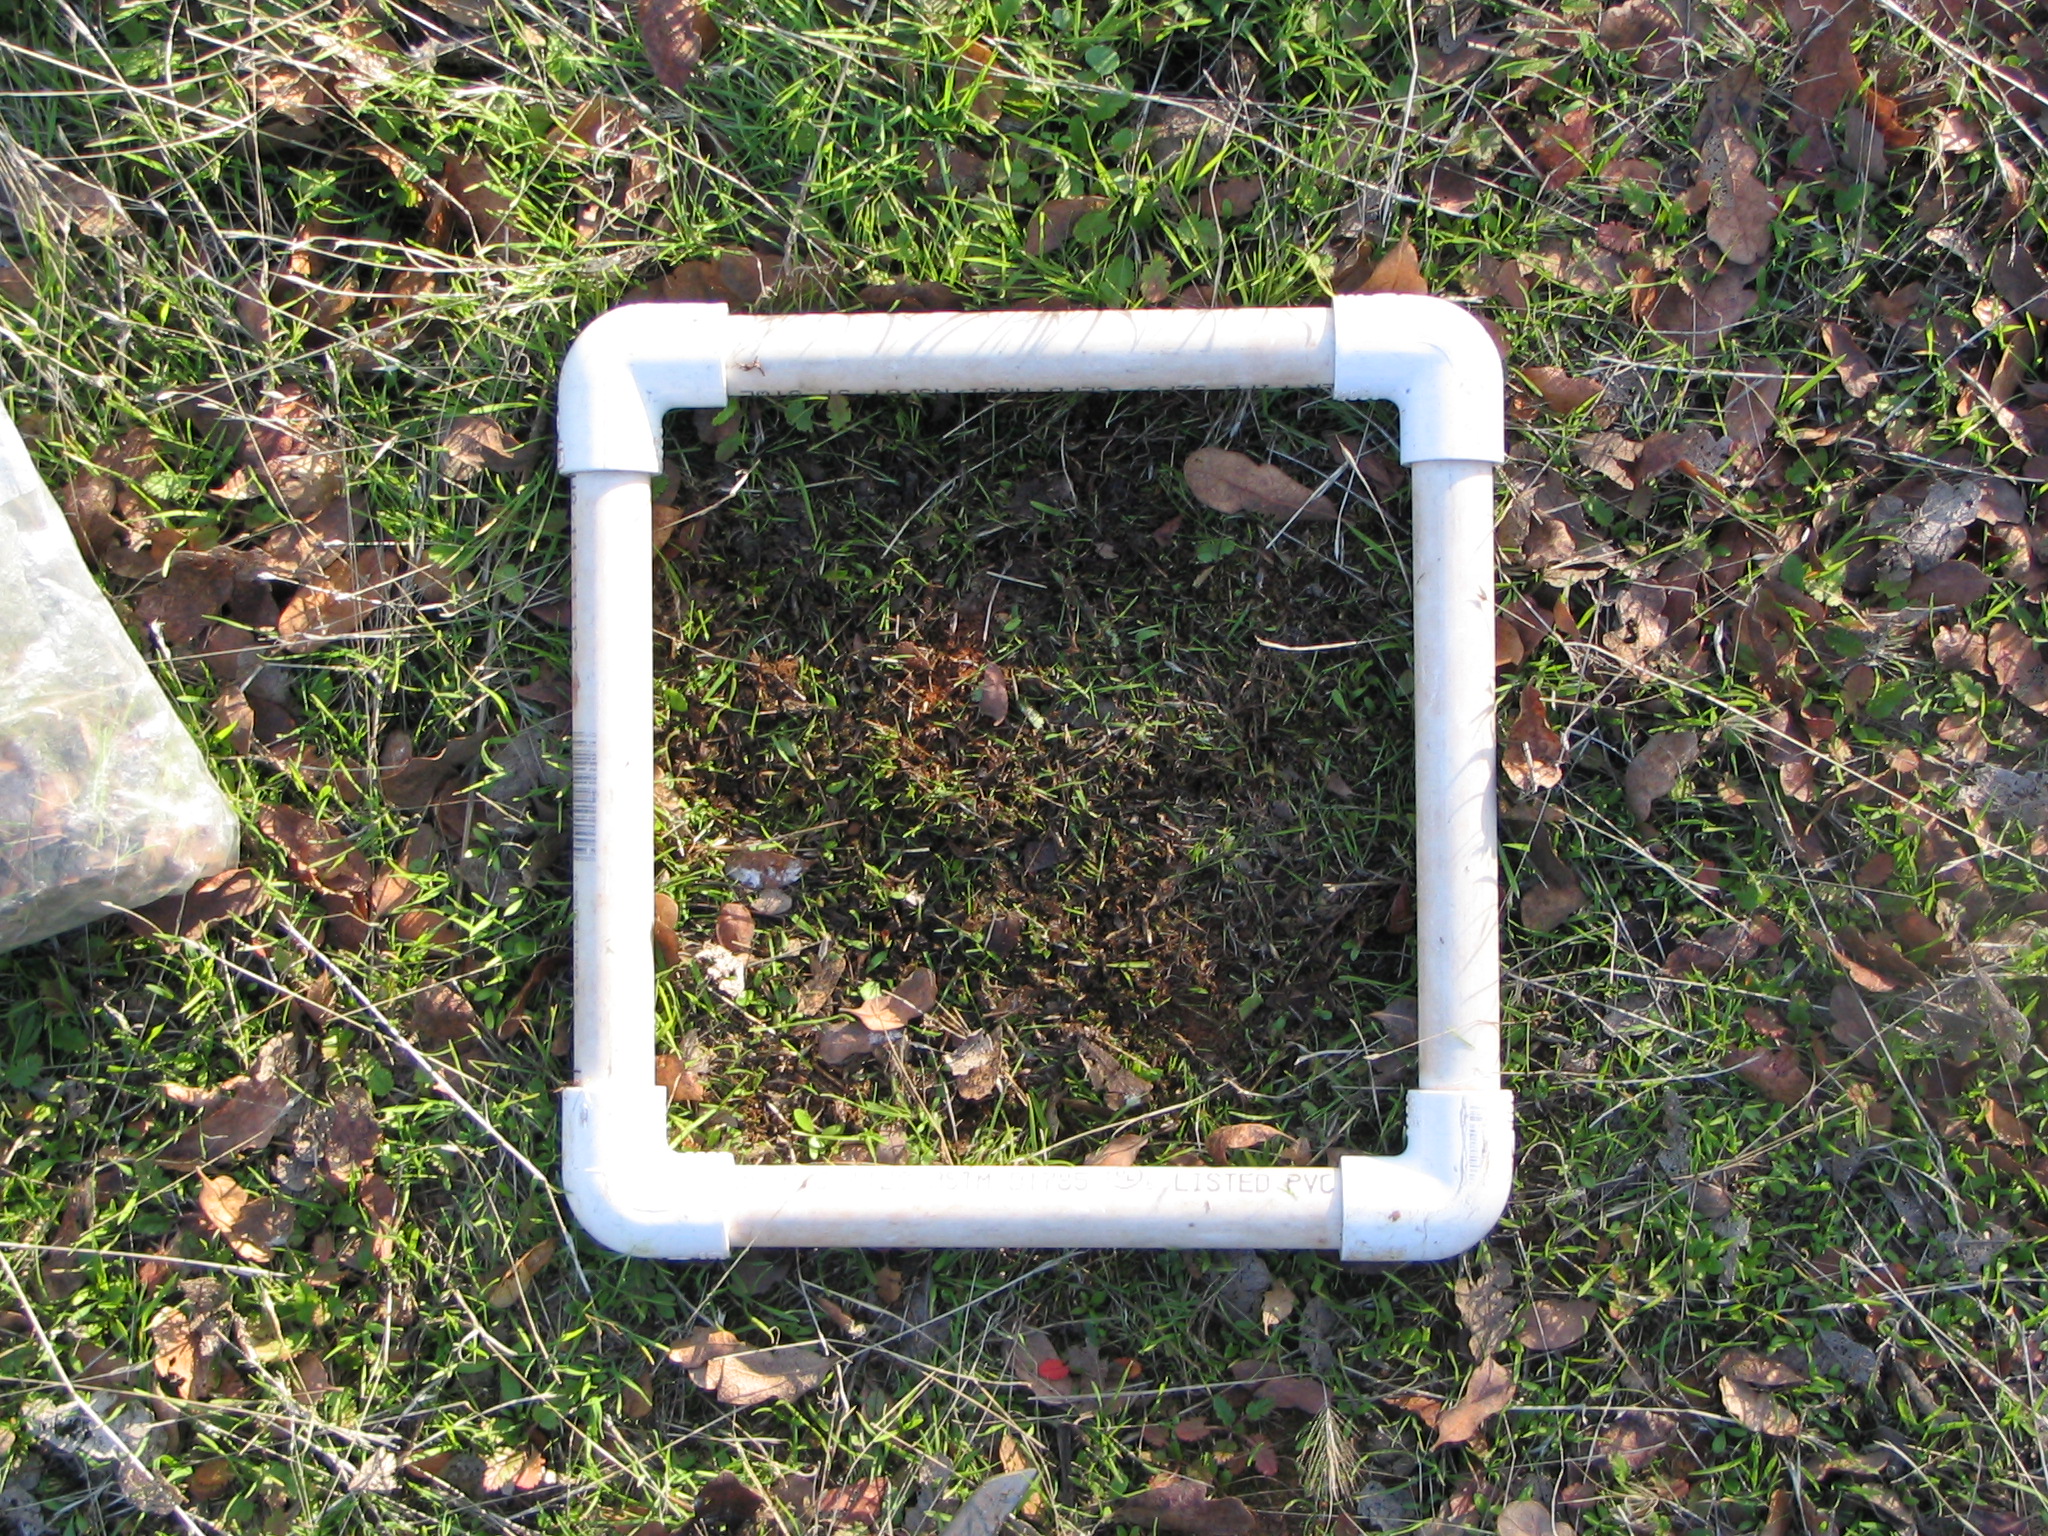
20081211TZ_BoimassSampleAfter.jpg ( 2008-12-11 15:16:39 ) Full size: 2048x1536
Biomass clip plot after harvest
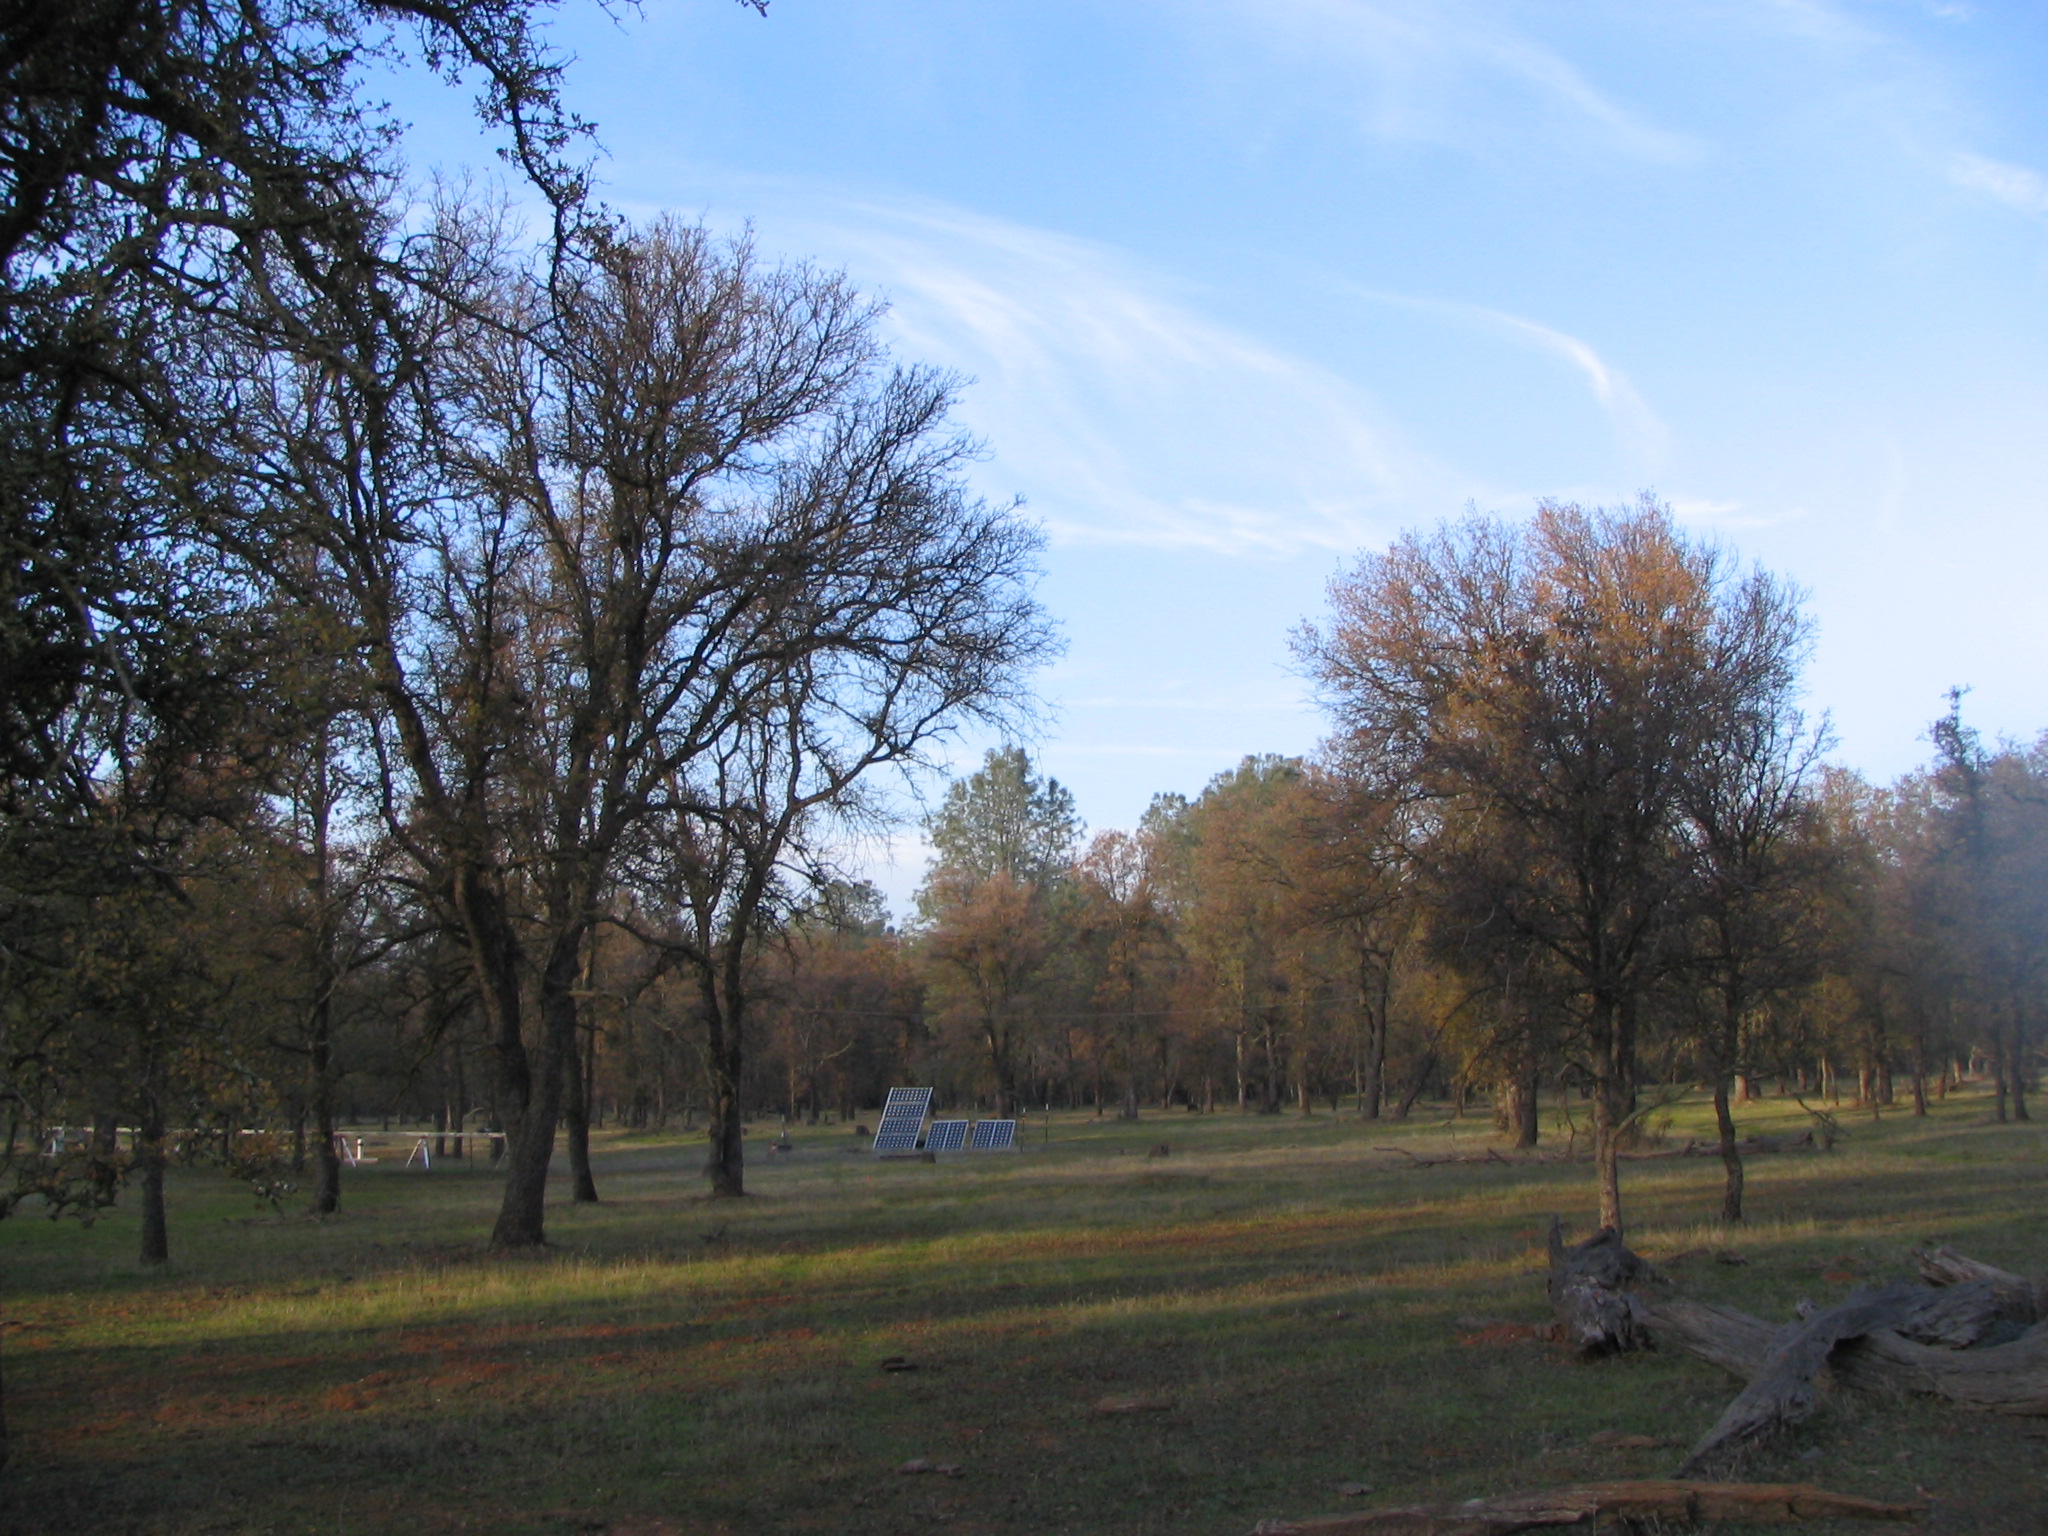
20081211TZ_Floor.jpg ( 2008-12-11 16:19:50 ) Full size: 2048x1536
Solar panels at Tonzi late season
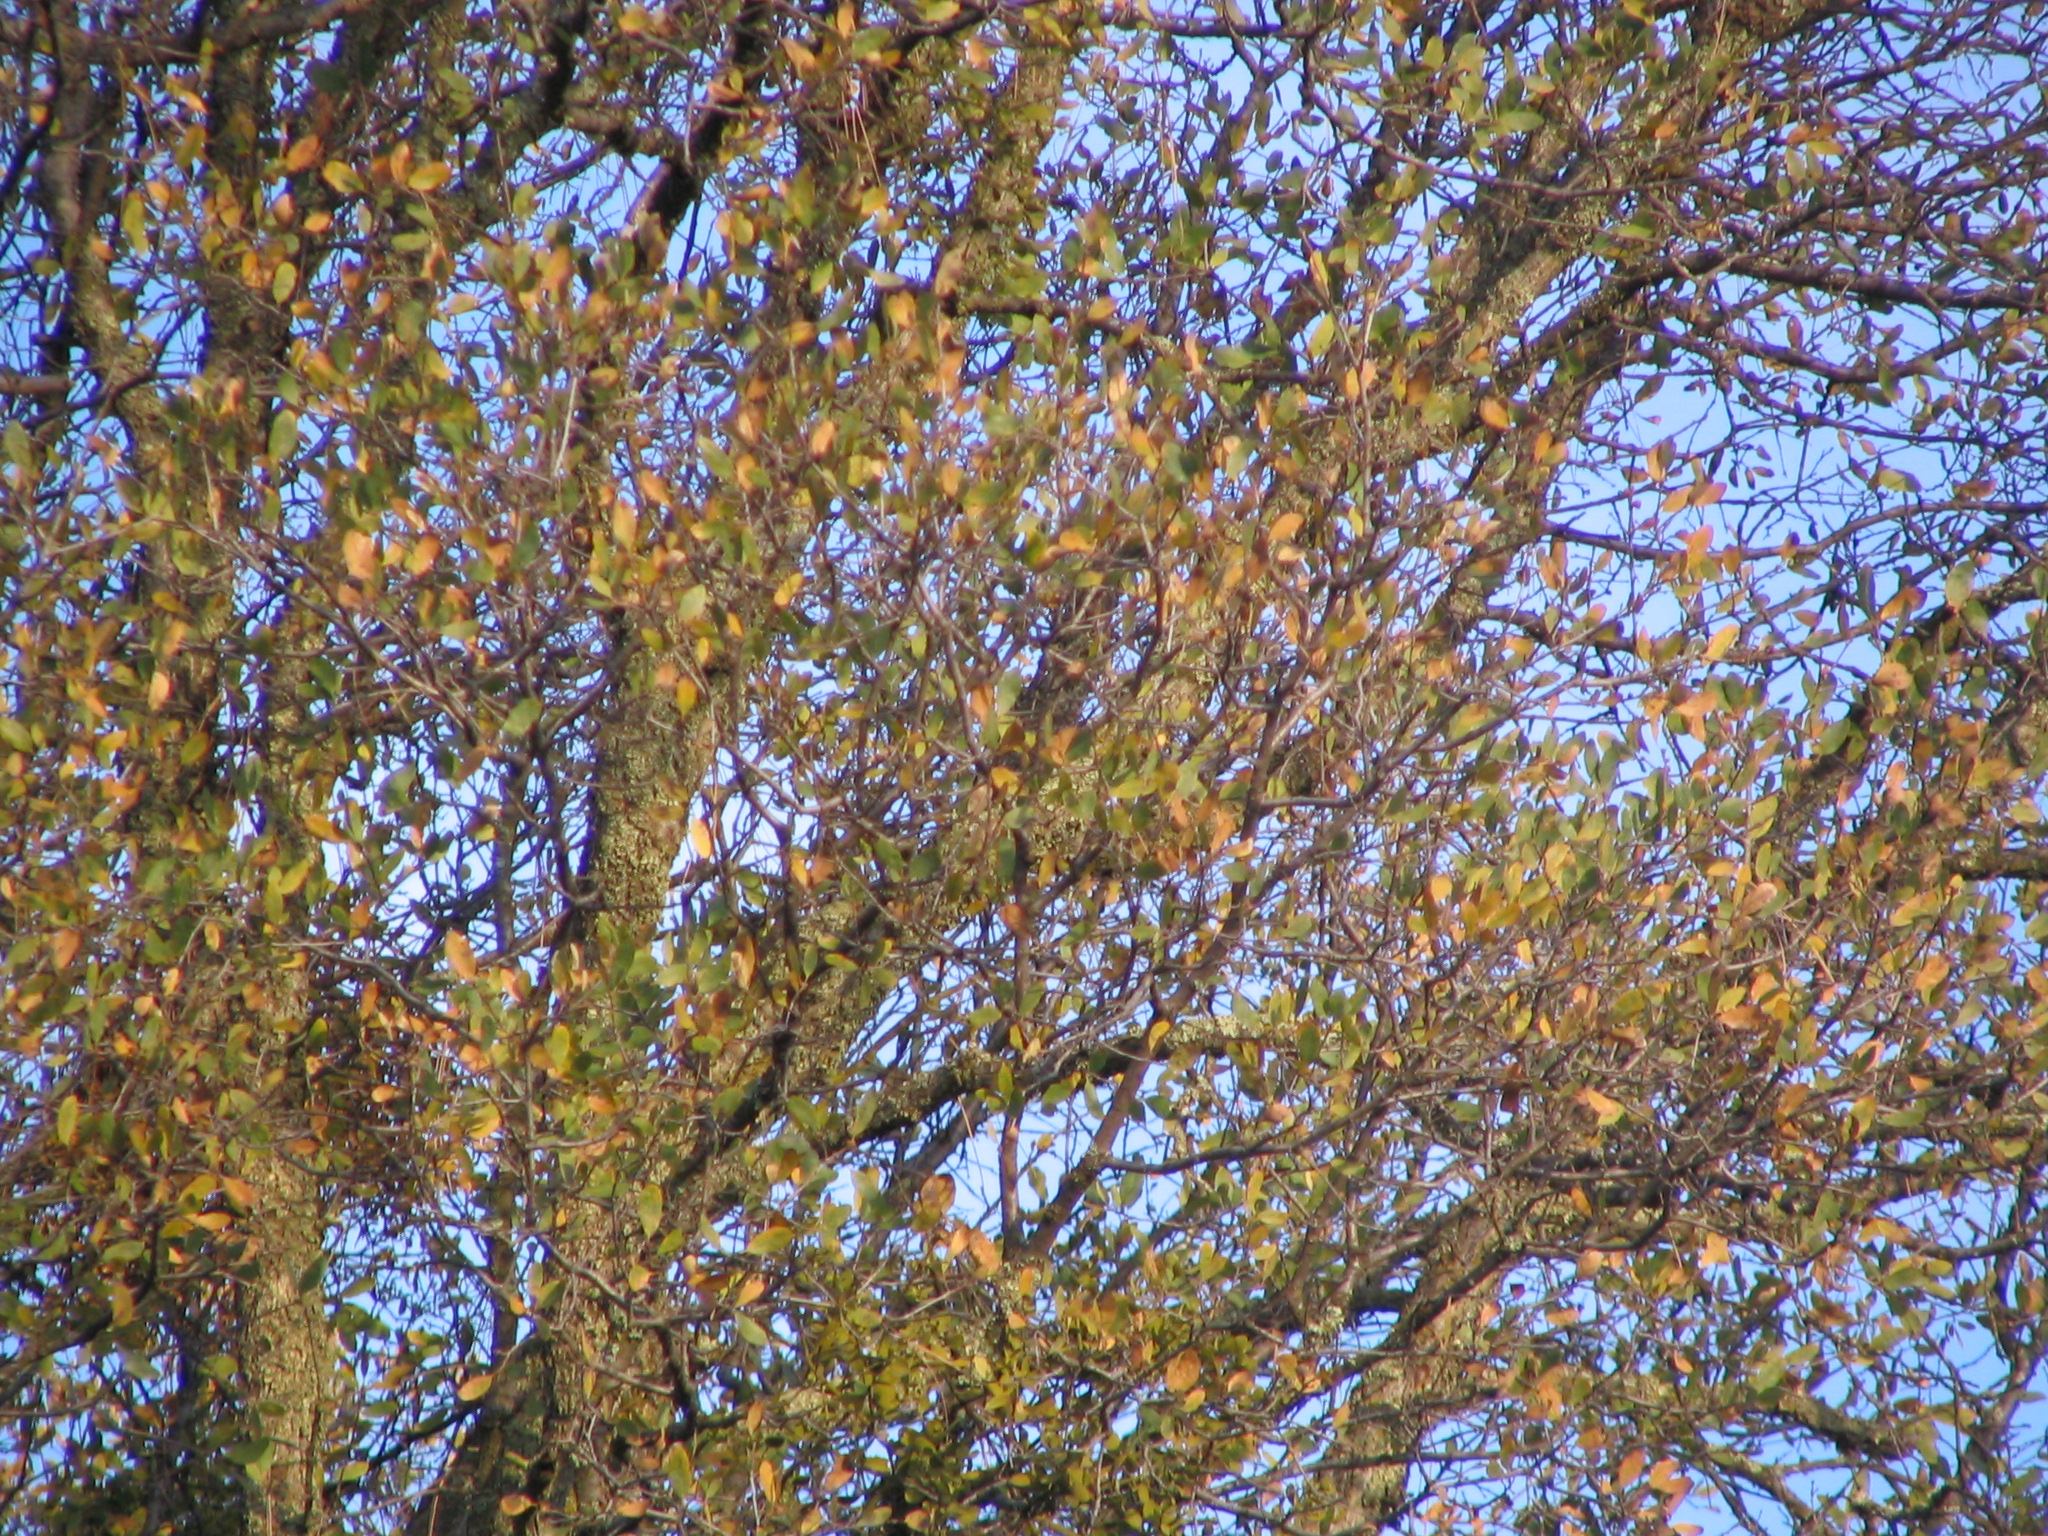
20081211TZ_Leaves.jpg ( 2008-12-11 16:20:07 ) Full size: 2048x1536
Oak tree leaves turning yellow
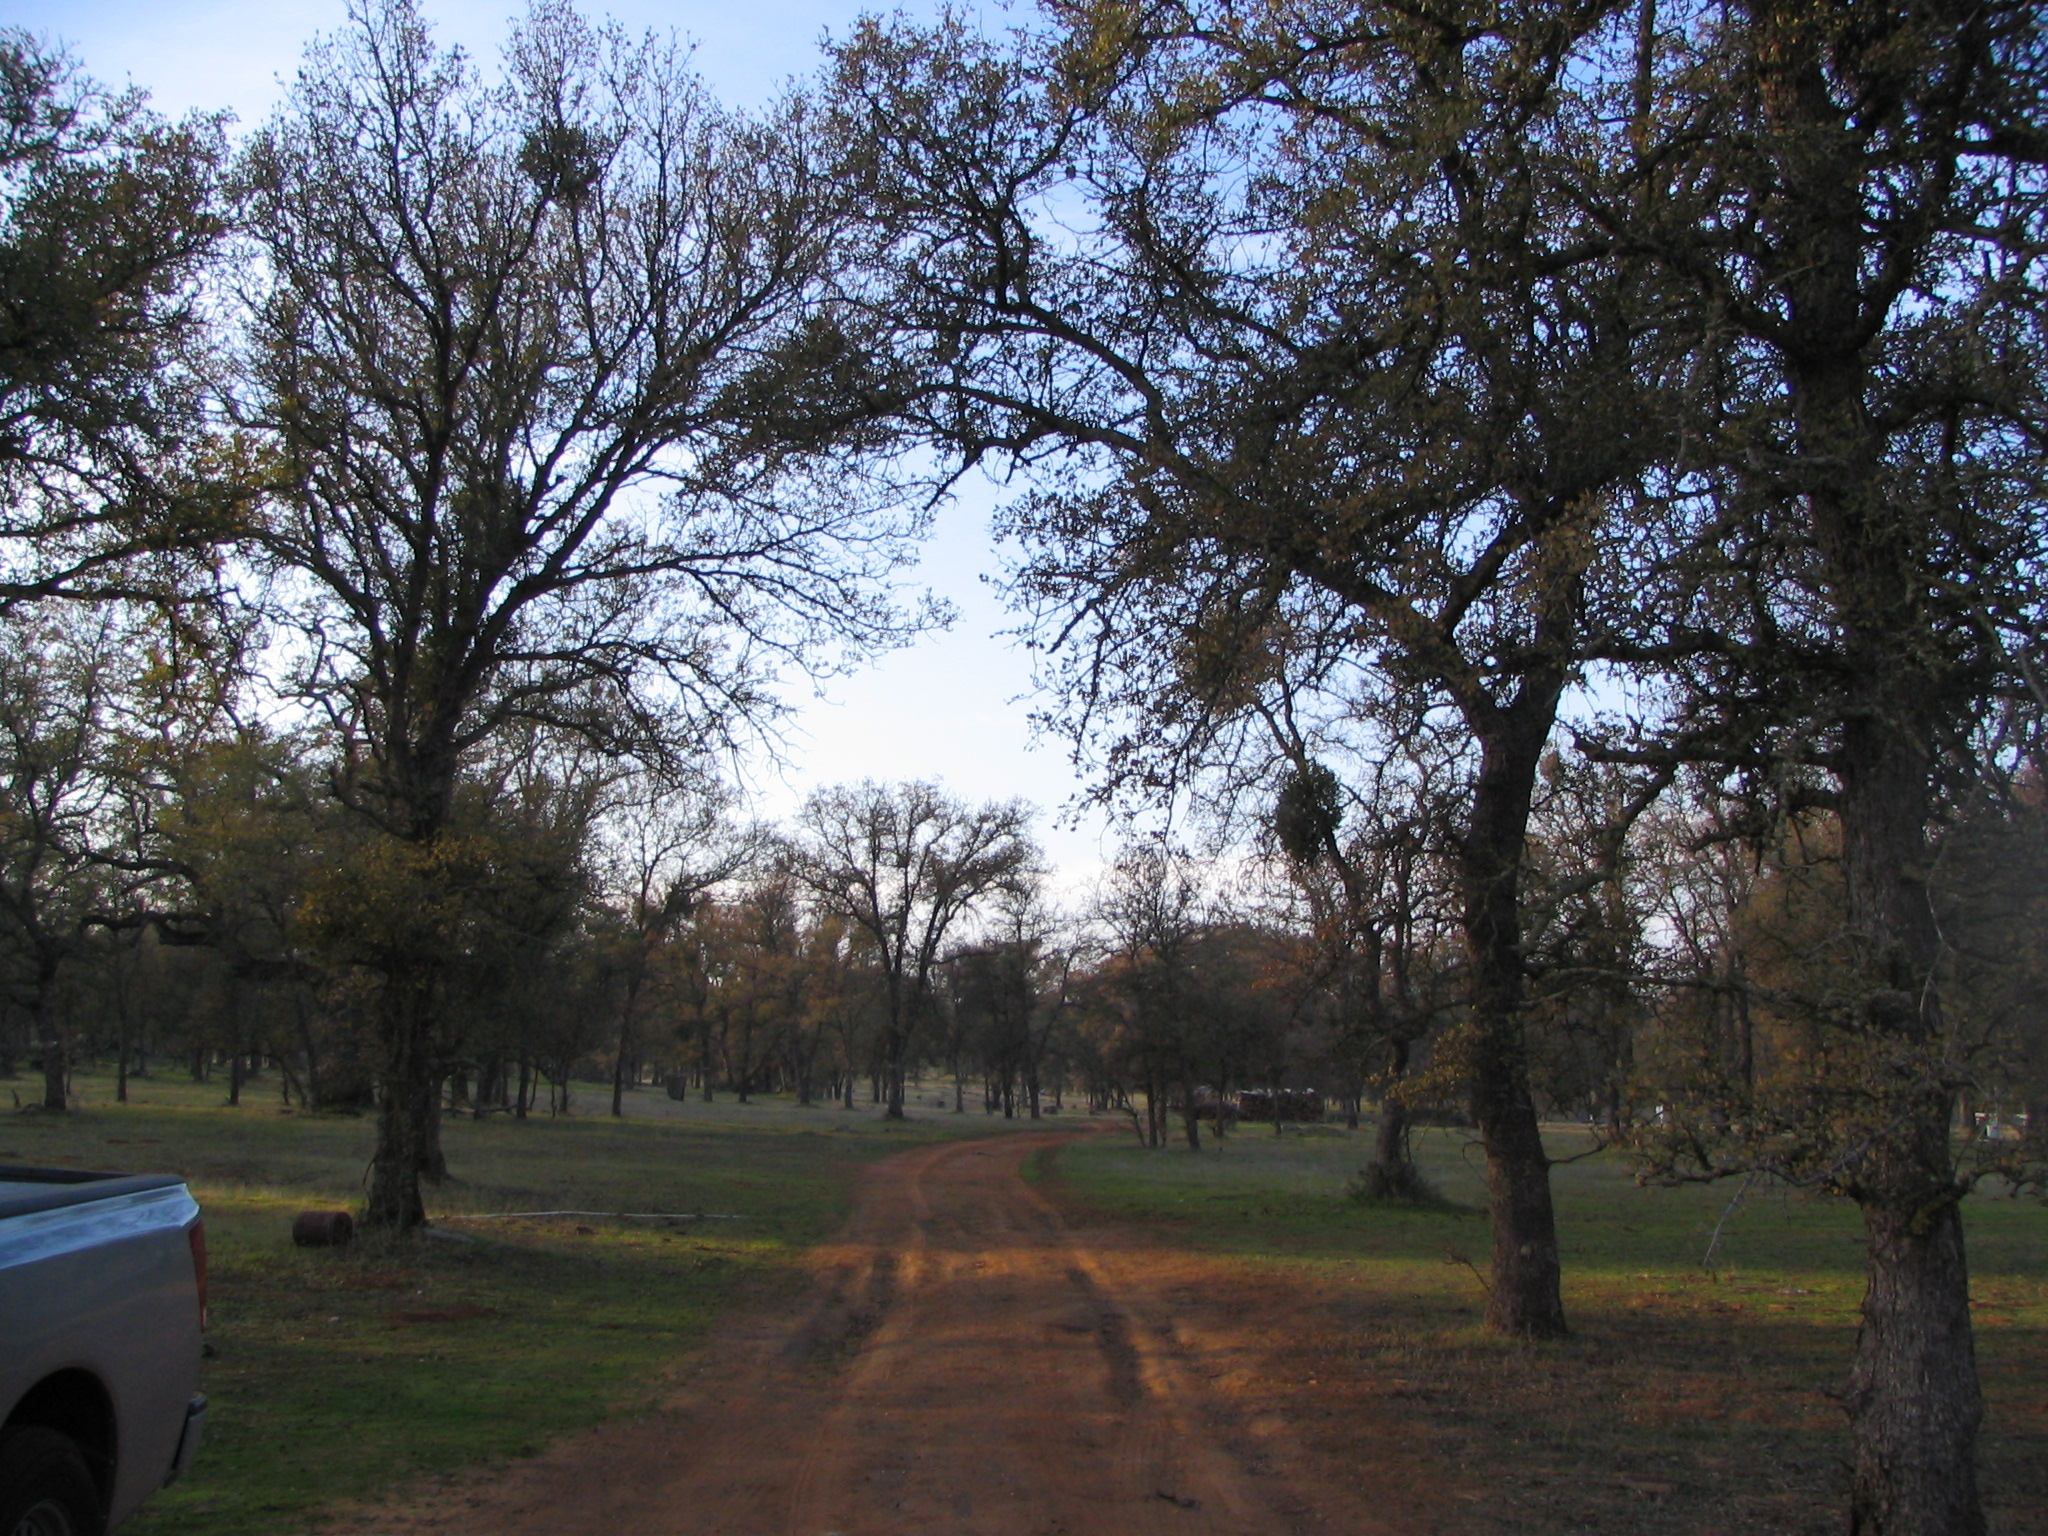
20081211TZ_Road.jpg ( 2008-12-11 16:20:16 ) Full size: 2048x1536
Dirt road through oak woodland
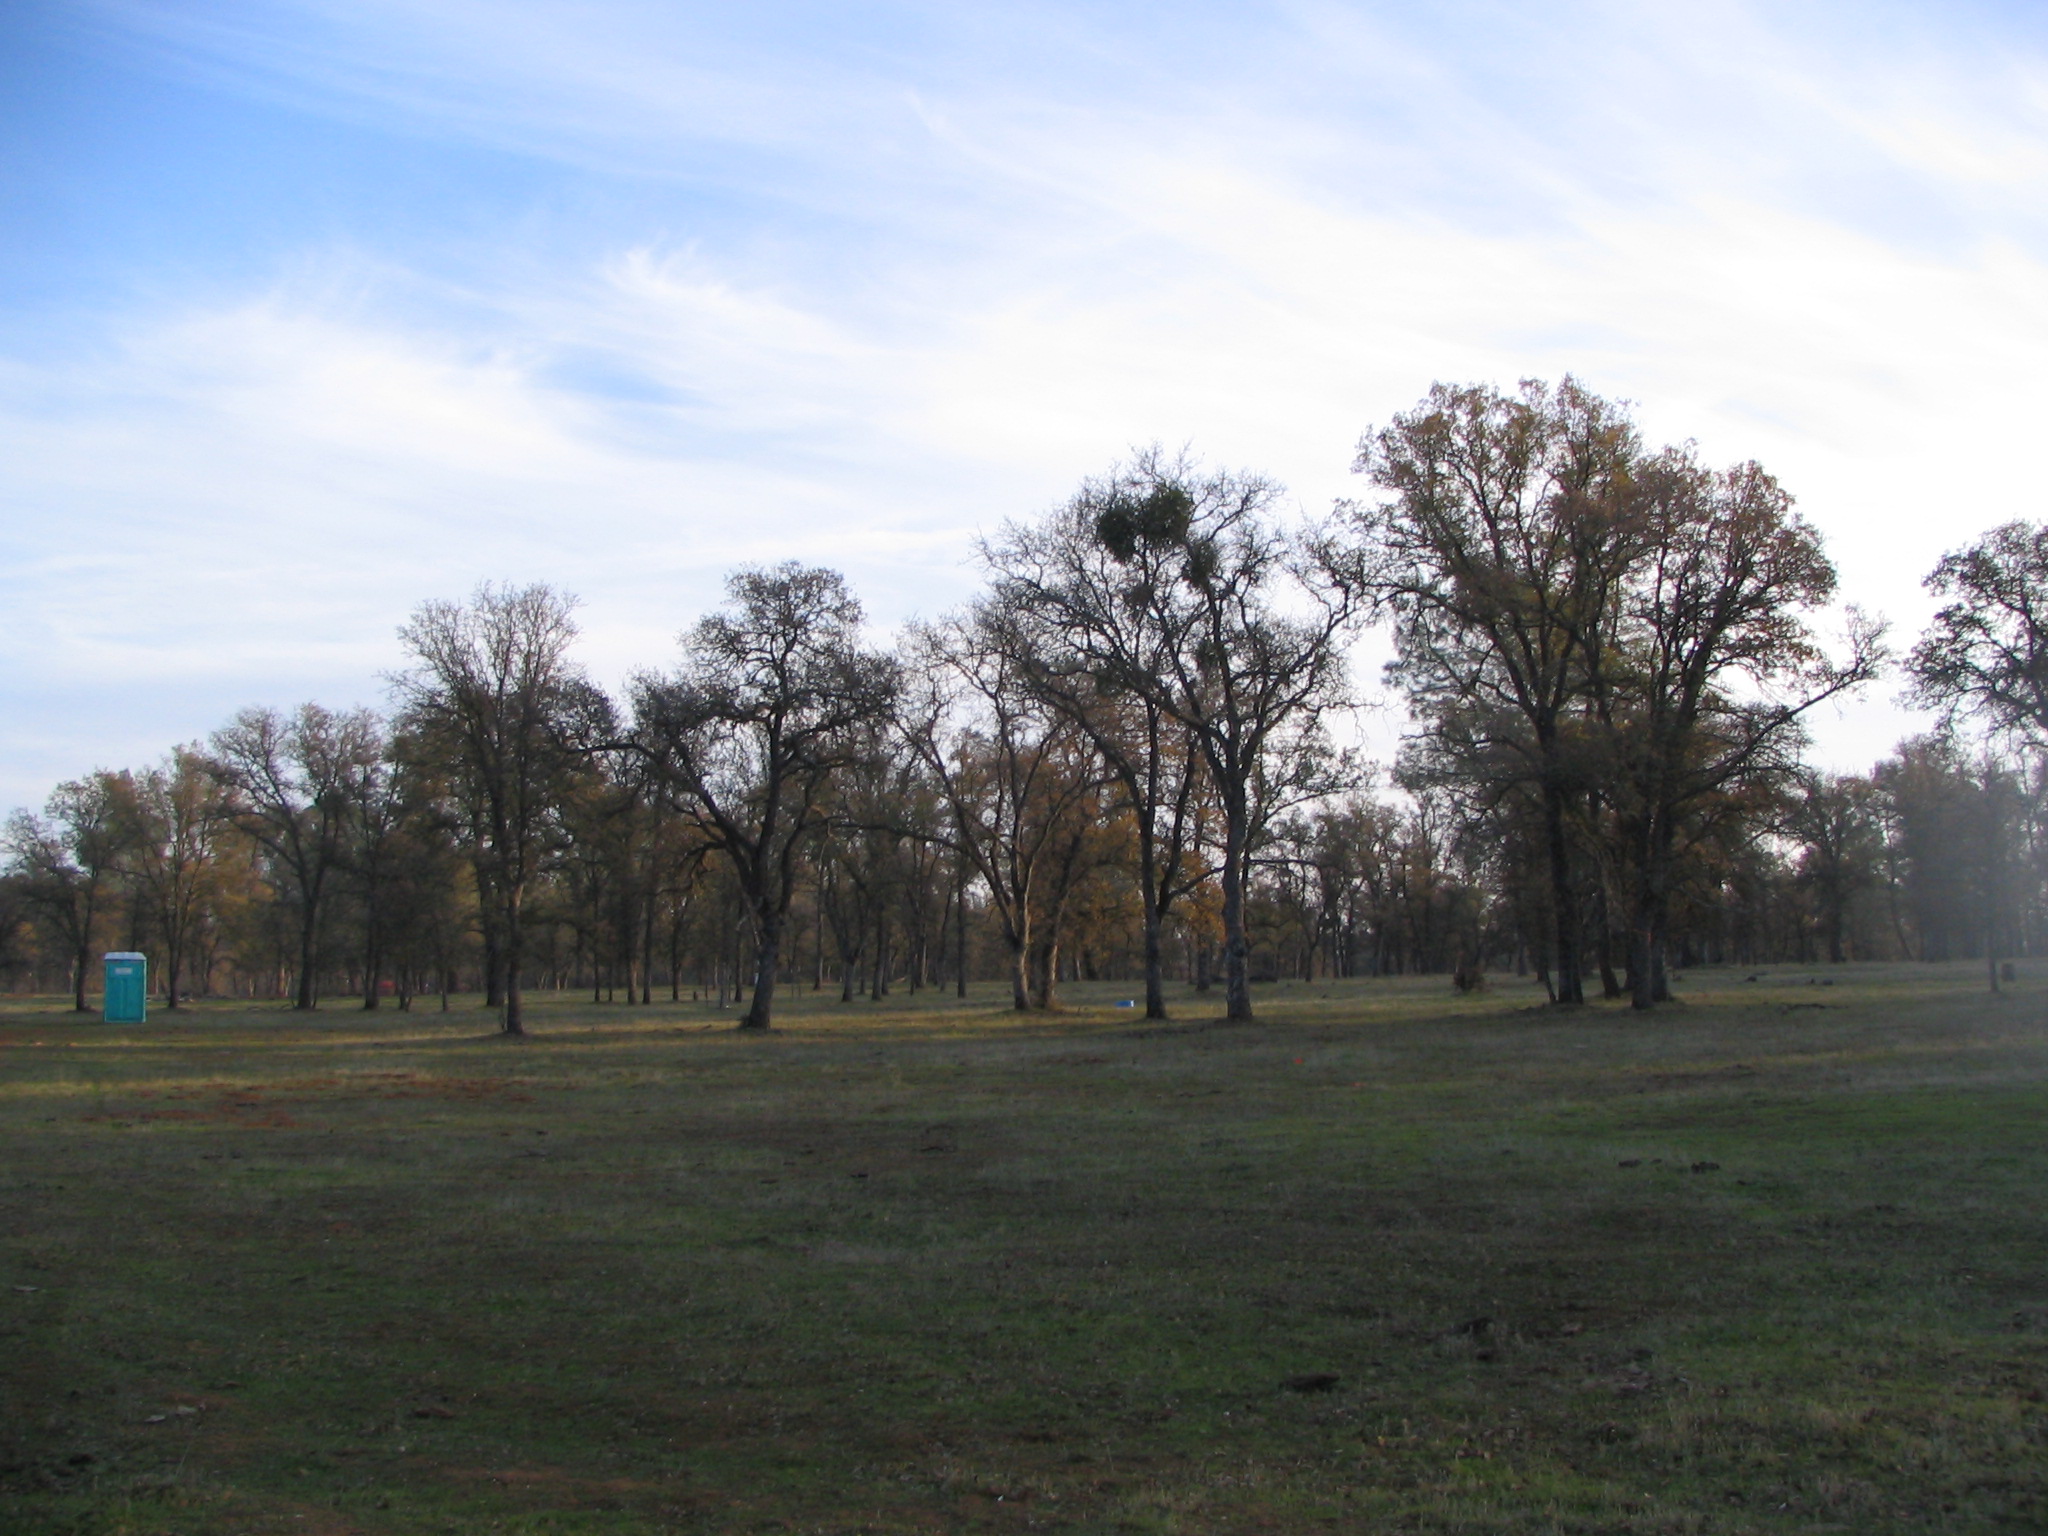
20081211TZ_SouthEast.jpg ( 2008-12-11 16:20:22 ) Full size: 2048x1536
Some new grass south east of the tower
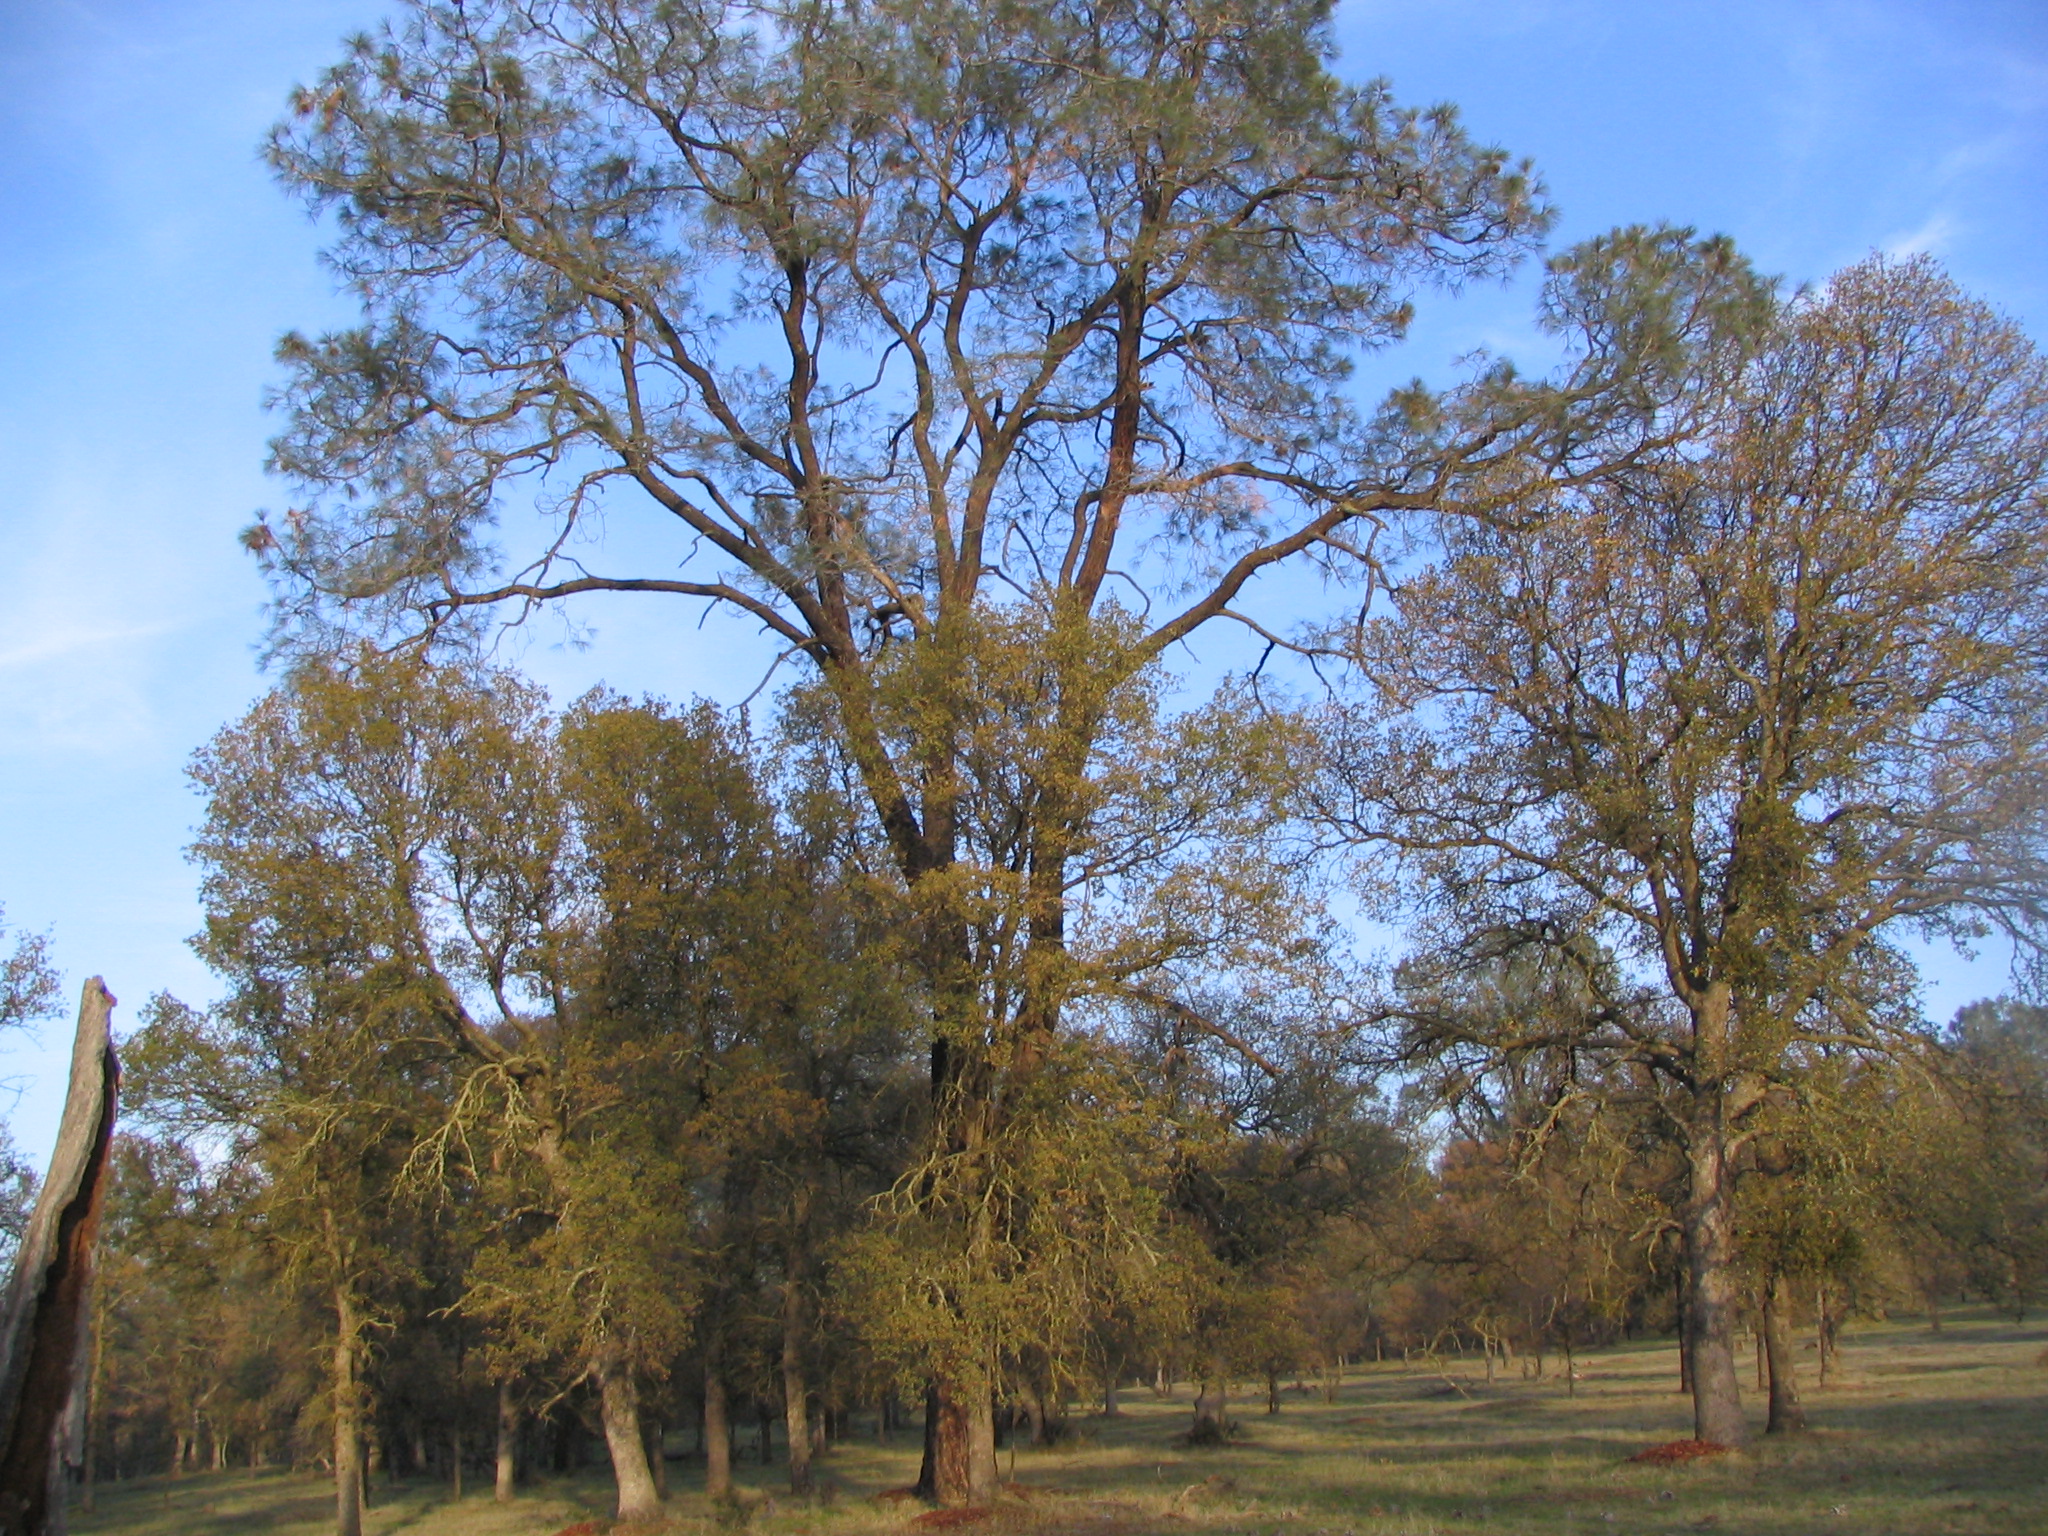
20081211TZ_Trees.jpg ( 2008-12-11 16:19:56 ) Full size: 2048x1536
Big pine tree at Tonzi
16 sets found
No data found for TZ_Fenergy.
11 TZ_tmet graphs found
11 TZ_soilco2 graphs found
Can't check TZ_mixed
3 TZ_mixed graphs found
No data found for TZ_fflux.
8 TZ_fmet graphs found
No data found for TZ_tram.
3 TZ_co2prof graphs found
No data found for TZ_irt.
1 TZ_windprof graphs found
No data found for TZ_tflux.
2 TZ_sm graphs found
Can't check TZ_met
1 TZ_met graphs found
Can't check TZVR_mixed
No data found for TZ_osu.
No data found for TZ_fd.
Tonzi Z-cam data