
Field Notes
<--2014-07-02 15:25:00 | 2014-07-08 13:00:00-->Phenocam link: Searching...
Mayberry: 2014-07-03 09:00:00 (DOY 184)
Author: Cove Sturtevant
Others: Dennis
Summary: Remounted portable tower on truck. Moved to High Veg site. Installed 10x with thermocouple rod and conductivity probe about 15 m into footprint. All well at permanent tower.
| Mayberry 2014-07-03 Portable Tower We arrived at the Low Veg portable tower site at about 09:00 PDT. It was sunny, breezy, and warm. We brought Dennis’ and remounted the portable tower in the back of the truck and moved it to the High Veg site. Sonic N at High Veg site: 291° N magnetic. Tower height (High Veg): 4.8 m above berm, and the berm in this location is about 30 cm above the water line. I downloaded the GHG files but forgot to download the 10x. At the High Veg site, I installed a stake about 15 m into the footprint along the trail Iryna had made for LAI measurements. I attached the enclosure box housing the 10x to the stake and installed the thermocouple rod and salinity sensor nearby. A larger stake would be better, as I had to put the plate with ubolt on the bottom of the enclosure box to keep it out of the water. The water at this location was about 30cm deep and with little to no slope of the soil surface. Next time I will check the water depth in the channel that runs a little farther out near the berm extending into the footprint. Readings after move to High Veg CO2: 394 ppm H2O: 625 mmol m-3 signal strength = 90.38% t: 24 °C p = 101.2 kPa sos = 346.4 m s-1 CH4: 1.91 ppm RSSI: 71% Reservoir was full. Permanent Tower All well. Collected data. Cleaned radiation sensors. Dennis accidentally bumped the rod holding the upward looking PAR sensor, so we should check the level next time we’re out. 7500 readings: CO2: 390 ppm H2O: 700 mmol m-3 signal strength = 96.27% t: 25 °C p = 101.2 kPa sos = 347.2 m s-1 Current 7700 readings: CH4 = 1.97 ppm RSSI = 58% Reservoir was full. Met looked good. Water CO2 was reading 4400 ppm. |
1 photos found
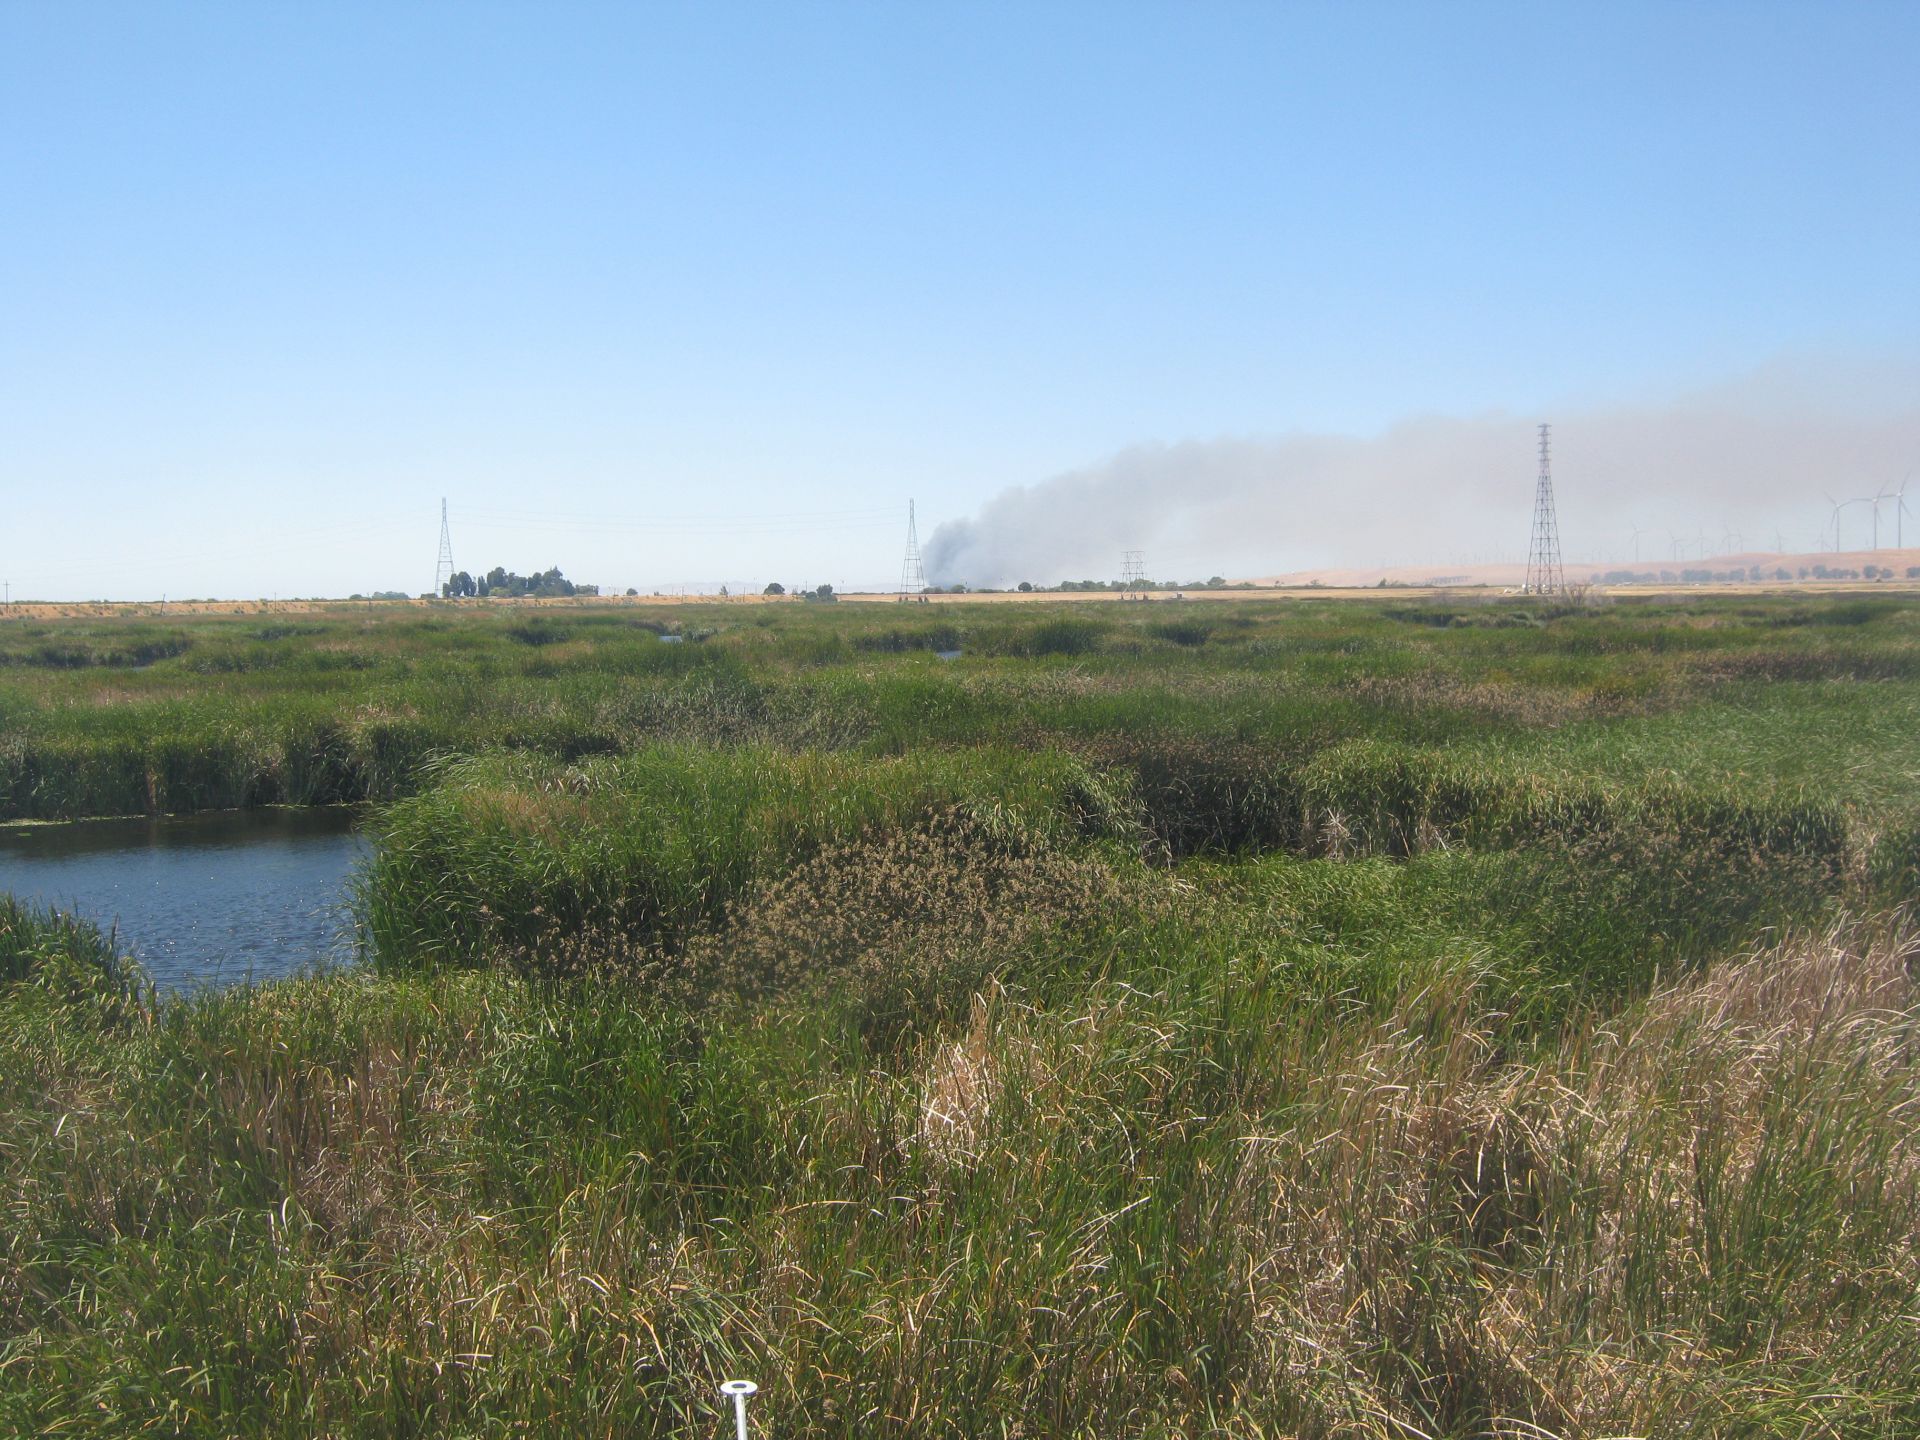
MB_autocam_20140704_1415.jpg ( 2014-07-04 14:15:02 ) Full size: 1920x1440
Fire to the west
11 sets found
7 MB_flux graphs found
No data found for MB_met.
28 MB_tule graphs found
Can't check MBWPEESWGT_mixed
1 MB_cam graphs found
Can't check MBEEWPSWEPGT_cam
Can't check SIMBTWEE_met
No data found for MB_minidot.
Can't check MBSWEEWPBCBA
1 MB_processed graphs found
Can't check MB_fd
1 MB_fd graphs found