
Field Notes
<--2013-10-18 10:00:00 | 2013-11-07 10:41:00-->Other sites visited today: Vaira | Tonzi
Phenocam link: Searching...
Tonzi: 2013-11-07 09:00:00 (DOY 311)
Author: Siyan Ma
Others: Joe
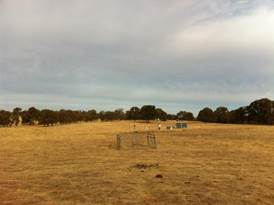
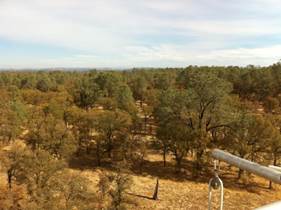
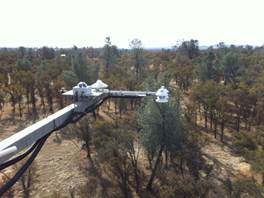
Summary: No rain yet! 90% of oak leaves turned into yellow or brown at Tonzi; cows and cars disturbed area at Vaira, swapped 7500s at Tonzi
|
When: Date: 11/7/2013 , Day: 311 , Watch Time: 9:00 am . Where: Tonzi/Vaira Ranch Who: Siyan, Joe Weather: clear, sunny Phenology: No rain yet in November! 90% of oak leaves turned into yellow or brown at Tonzi; cows and cars heavily disturbed the area outside of the fence at Vaira.
Summary
Vaira_Grass Site
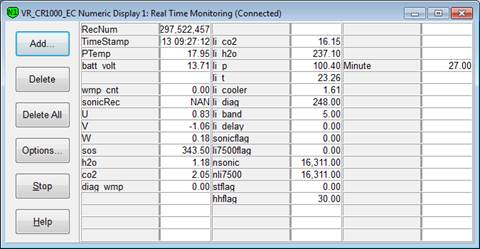
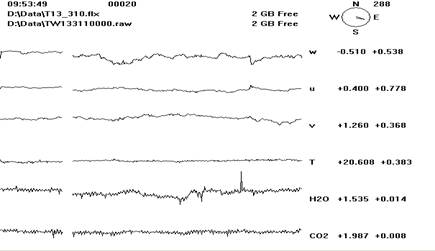
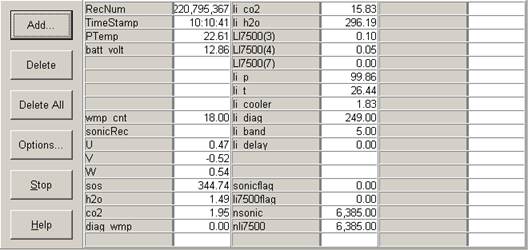
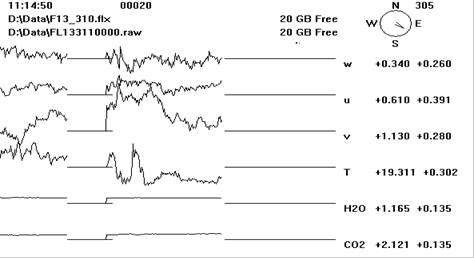
Tonzi_Tower Site
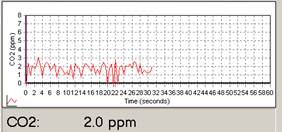
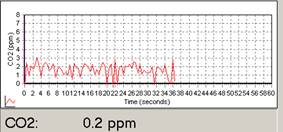
Is the pump running‌ YES! 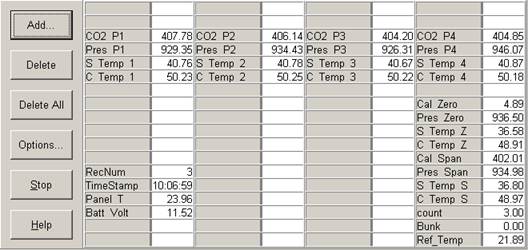 Zero
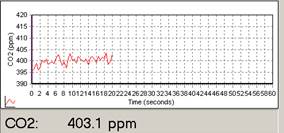
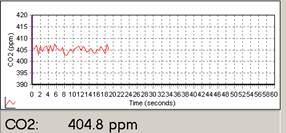
Span
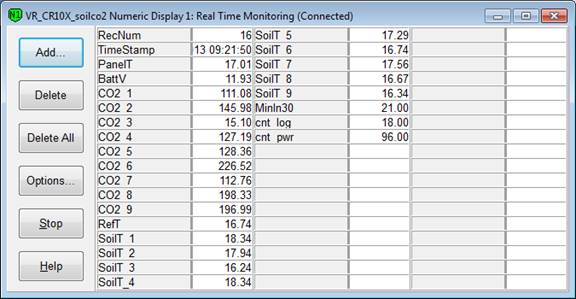
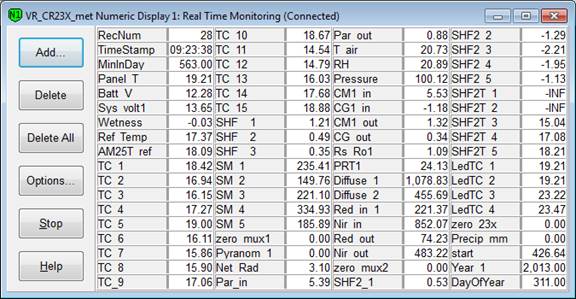
Toniz_Floor Site
CR23X3 – floor-Met CR23X6 – tower-Met CR10X2 – floor-Met Soil CO2 profile: CR23X5 – soil CO2 profile 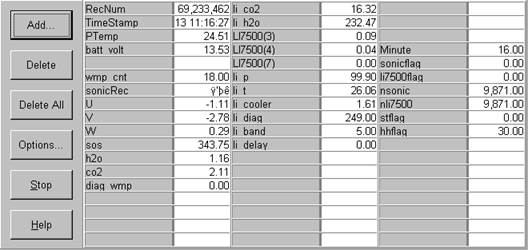    
|
Field Data
No tank data
Well Depth
| Date | Location | Depth (feet) |
|---|---|---|
| 2013-11-07 | TZ_floor | 31.5 |
| 2013-11-07 | TZ_road | 39.3 |
| 2013-11-07 | TZ_tower | 36.1 |
No TZ Moisture Point data found
No VR Moisture Point data found
No TZ grass heigth found
No VR grass heigth found
Tree DBH
| Date | Tag# | Reading (mm) |
|---|---|---|
| 2013-11-07 | 102 | 20.4 |
| 2013-11-07 | 2 | 16.9 |
| 2013-11-07 | 245 | 12.7 |
| 2013-11-07 | 3 | 19.7 |
| 2013-11-07 | 4 | 3.9 |
| 2013-11-07 | 5 | 24.6 |
| 2013-11-07 | 7 | 16.5 |
| 2013-11-07 | 72 | 15.1 |
| 2013-11-07 | 79 | 19 |
| 2013-11-07 | 8 | 8.5 |
No water potential data found
No TZ Grass Biomass data found
No TZ OakLeaves Biomass data found
No TZ PineNeedles Biomass data found
0 photos found
16 sets found
No data found for TZ_Fenergy.
11 TZ_tmet graphs found
11 TZ_soilco2 graphs found
Can't check TZ_mixed
3 TZ_mixed graphs found
1 TZ_fflux graphs found
8 TZ_fmet graphs found
1 TZ_tram graphs found
3 TZ_co2prof graphs found
No data found for TZ_irt.
No data found for TZ_windprof.
1 TZ_tflux graphs found
2 TZ_sm graphs found
Can't check TZ_met
1 TZ_met graphs found
Can't check TZVR_mixed
8 TZ_osu graphs found
No data found for TZ_fd.
Tonzi Z-cam data