Field Notes
<--2008-05-06 08:55:00 |
2008-06-26 12:00:00-->
Phenocam link:
Searching...Tonzi: 2008-05-31 00:00:00 (DOY 152)
Author: Siyan Ma
Others: Jessica
When: Date: , Day: ,
Watch Time: .
Where: Tonzi/Vaira Ranch
Who: Siyan, Jessica
Weather:
clear, nice breeze
Phenology:
yellow grasses, see some yellow and big purple flowers
Summary
- Pre-dawn water potential measurement
- help Jessica do some leaf N measurements
- check and download data at Tower, Floor, and Vaira
- collect oak leaves and branches
for LMA and N
- read dendrometer
- measure soil moisture
Vaira_Grass
Site
- Fence and gate power: 12
v.
- Panel and Batteries: 13.0 v; 5.4 amps; 3.0 amps.
- Reading from Gillsonic screen
before downloading data. (The value
of H2O and CO2 should be in the range of 0 – 5 v.)
Time
|
|
Path/File name
|
D:\Data\V08_ 152
.flx
D:\Data\VR08 .raw
|
|
mean
|
std
|
|
mean
|
std
|
w
|
-0.87
|
0.561
|
Ts
|
24.8
|
1.642
|
u
|
0.21
|
2.497
|
H2O
|
1.5
|
0.025
|
v
|
1.87
|
1.247
|
CO2
|
2.2
|
0.037
|
|
|
|
Tc
|
2.6
|
0.223
|
- downloading data : YES!
- Check the fans of air temp.
and relative humidity sensors at Vaira. YES!
- Check MD-9 system connections
YES!
- Check levels of Radiation
sensors, clear up surfaces. YES!
- Check rain gage, make sure
not clogged. YES!
- Closed gate and set up fence.
YES!
Tonzi_Tower Site
- Fence and gate power: 12
v.
- Panel and Batteries: 14.0 v; 0.0 amps; 5.1 amps.
- Reading from Gillsonic screen
before downloading data. (The value
of H2O and CO2 should be in the range of 0 – 5 v.)
Time
|
|
Path/File name
|
D:\Data\T08_
152 .flx
D:\Data\TW08 .raw
|
|
mean
|
std
|
|
mean
|
std
|
w
|
|
|
Ts
|
|
|
u
|
|
|
H2O
|
|
|
v
|
|
|
CO2
|
|
|
- downloading data YES!
- check the fans of air temp.
and relative humidity sensors on the tower and the floor.
- Check rain gage, make sure
not clogged. YES!
- Check calibration cylinders;
CO 2 1700 psig; flow 18
psi.
N 2 1800
psig; flow 20
psi.
Manually calibrate Li-800. Following Ted’s instruction: H:\IoneSavanna_2004\Tower_2004\CO2Profile\LI800_Calibration_Procedure_2Nov04.txt
Is the pump running
How to check the CO2 values
Click “Ports/Flags” button to see which ports or flags is setting
high. Pressure should be less than
ambient value. When Flag 8 is high, it
may indicate that RRR’s battery is low.
1
|
2
|
3
|
4
|
zero
|
span
|
393
|
387
|
384
|
386.8
|
1.707
|
436.6
|
939
|
939
|
939
|
939.3
|
939
|
438.9
|
45.3
|
45.5
|
45.5
|
45.5
|
44.6
|
44.6
|
49.9
|
49.9
|
49.9
|
49.9
|
49.3
|
49.4
|
- close gate and set up fence. YES!
Toniz_Floor
Site
- Fence and gate power: 12
v.
- Panel and Batteries: 13.6 v; 9.8 amps; 1.8 amps.
- Reading from Gillsonic screen
before downloading data. (The value
of H2O and CO2 should be in the range of 0 – 5 v.)
Time
|
|
Path/File name
|
D:\Data\F08_ 152 .flx
D:\Data\FL08 .raw
|
|
mean
|
std
|
|
mean
|
std
|
w
|
0.36
|
0.276
|
Ts
|
20.0
|
0.824
|
u
|
0.56
|
0.022
|
H2O
|
2.5
|
0.023
|
v
|
0.8
|
1.030
|
CO2
|
1.47
|
0.014
|
- downloading data: YES!
- Check MD-9 system connections
YES!
CR23X3 – floor-Met
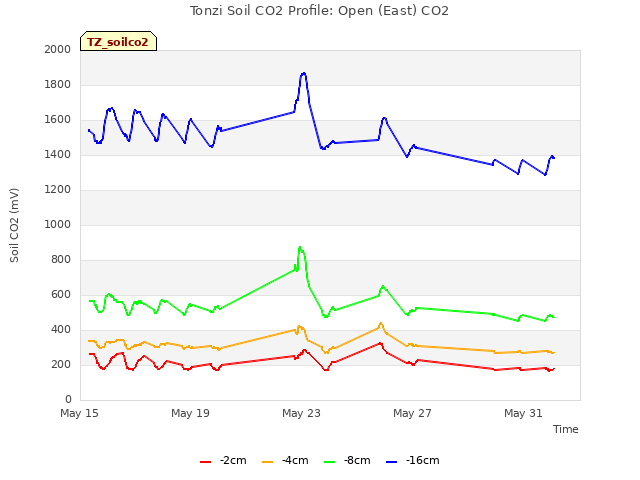
CR23X5 – soil CO 2
profile
CR23X6 – tower-Met
CR10X2 – floor-Met
CR10X4 – sap-flow
CR10X7 – CO 2 profile
CR10X8 – wind profile
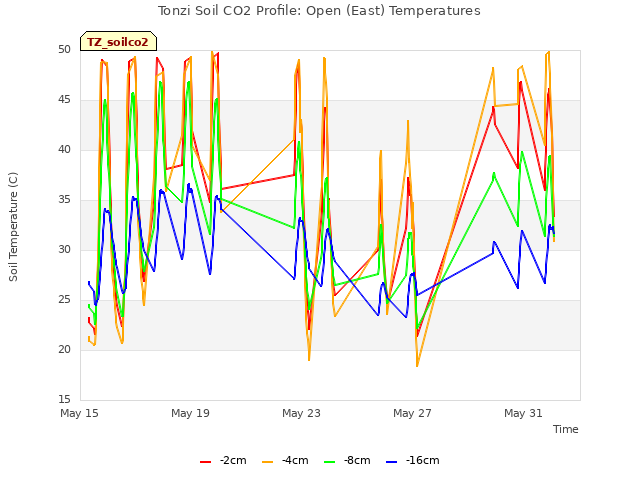
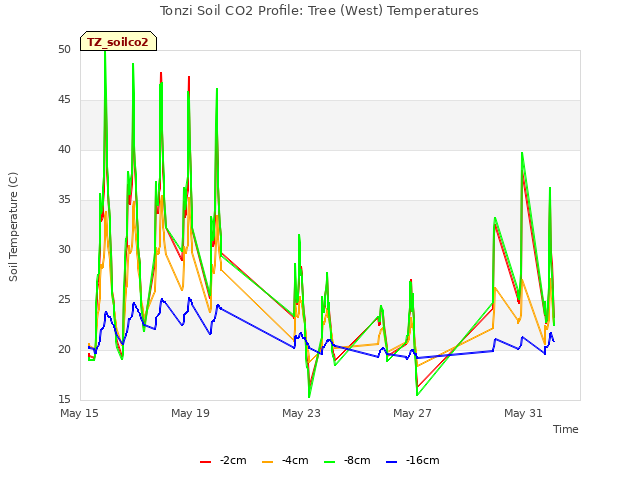
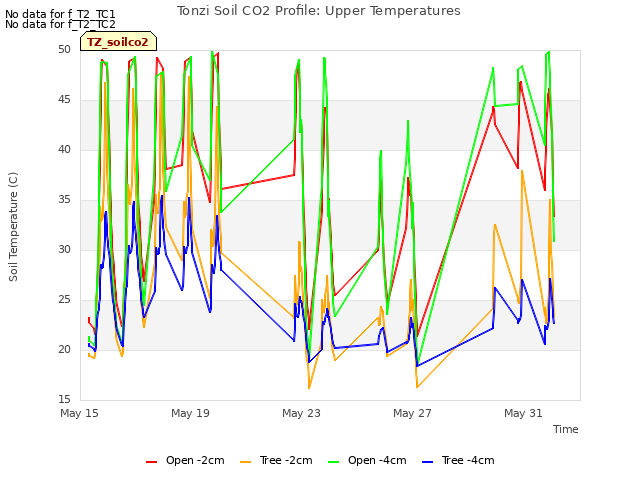
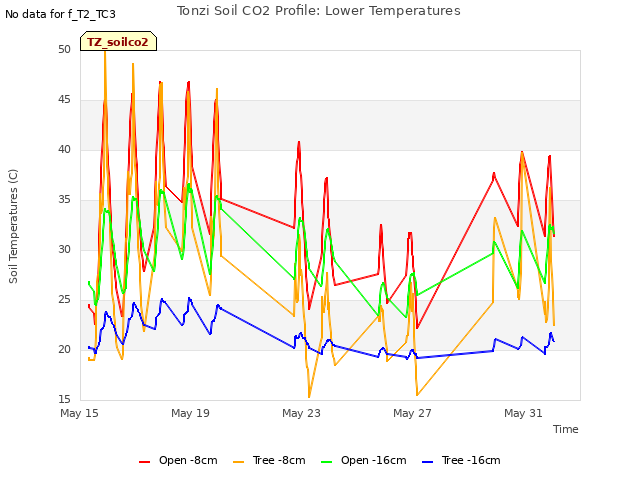
- Soil CO2 profile
Reading
from datalogger
Panel
temp
|
29.2
|
|
|
Battery
voltage
|
15.0
|
|
|
CO2E_1
|
181.5
|
TCE_1
|
43.2
|
CO2W_1
|
617
|
TCW_1
|
22.7
|
CO2E_2
|
279
|
TCE_2
|
50.7
|
CO2W_2
|
704
|
TCW_2
|
22.1
|
CO2E_3
|
463
|
TCE_3
|
35.9
|
CO2W_3
|
969
|
TCW_3
|
23.1
|
CO2E_4
|
659
|
TCE_4
|
29.2
|
CO2W_4
|
258
|
TCW_4
|
20.1
|
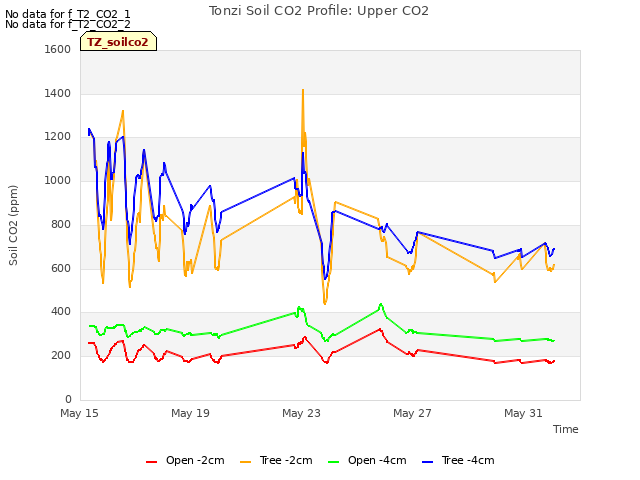
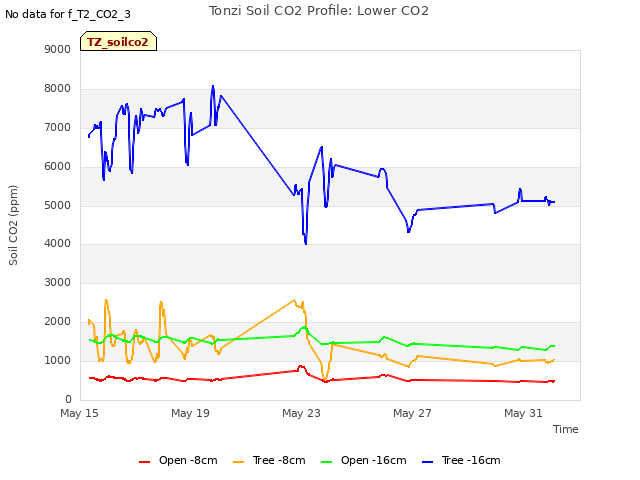
Reading
from panels of analyzers
depth
|
Open
|
order
|
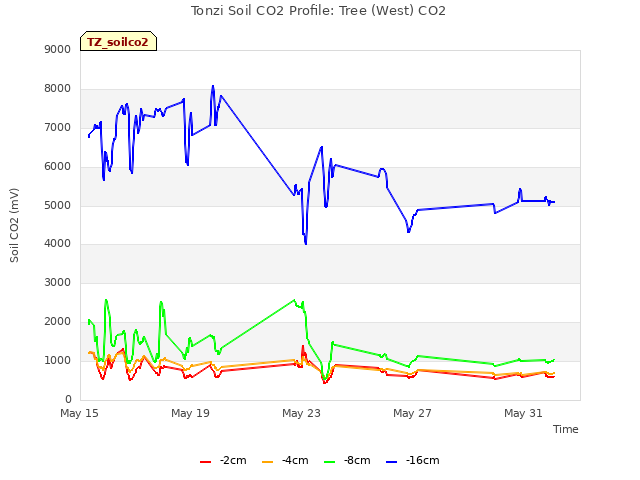
depth
|
Tree
|
order
|
2cm
(1%)
|
360
|
1
|
2cm
(1%)
|
1200
|
1
|
4cm
|
560
|
2
|
4cm
|
1420
|
2
|
8cm
|
970
|
3
|
8cm
|
1880
|
3
|
16cm
|
1340
|
4
|
16cm
|
5160
|
4
|
- Close gate and set up fence. YES!
Tonzi
|
|
|
|
Dendrometer
|
|
|
|
|
|
|
Date
|
Day
|
Tag #
|
Reading (cm)
|
5/31/2008
|
152
|
71
|
X
|
|
|
72
|
9.6
|
|
|
77
|
X
|
|
|
78
|
X
|
|
|
79
|
14.0
|
|
|
245
|
5.0
|
|
|
248
|
15.9
|
|
|
250
|
11.1
|
|
|
255
|
X
|
|
|
252
|
X
|
|
|
102
|
6.1
|
Notes:
“X” means not working any more.
tonzi
|
7931AFE
|
402165
|
574B4B
|
402FF3
|
574632
|
7A432E
|
7A3C6E
|
7A3B40
|
7A4AAA
|
31-May-08
|
152
|
|
|
|
|
|
|
|
|
|
SM
|
|
|
|
|
|
|
|
|
0-15
|
5.6
|
2.0
|
13.1
|
2.7
|
11.4
|
0.1
|
8.5
|
7.4
|
4.4
|
15-30
|
13.3
|
12.1
|
10.6
|
13.2
|
8.0
|
7.7
|
13.5
|
7.1
|
4.4
|
30-45
|
19.8
|
14.0
|
11.9
|
18.4
|
6.6
|
10.6
|
14.3
|
18.2
|
14.6
|
45-60
|
16.3
|
9.0
|
14.9
|
17.6
|
21.2
|
12.8
|
15.1
|
25.5
|
12.4
|
|
|
|
|
|
|
|
|
|
|
|
A6D882B
|
A3D04E8
|
A6D72F5
|
|
|
|
|
|
|
|
|
|
|
|
|
|
|
|
|
0-15
|
10.2
|
7.6
|
3.3
|
|
|
|
|
|
|
15-30
|
7.5
|
8.6
|
12.1
|
|
|
|
|
|
|
30-45
|
18.0
|
19.2
|
13.4
|
|
|
|
|
|
|
45-60
|
19.9
|
20.8
|
6.2
|
|
|
|
|
|
|
|
|
|
|
|
|
|
|
|
|
vaira
|
57318a
|
7933dee
|
|
|
|
|
|
|
|
0-15
|
3.4
|
5.3
|
|
|
|
|
|
|
|
15-30
|
6.6
|
8.7
|
|
|
|
|
|
|
|
30-45
|
13.1
|
12.3
|
|
|
|
|
|
|
|
|
Field Data
No tank data
No TZ Well data found
No TZ Moisture Point data found
No VR Moisture Point data found
No TZ grass heigth found
No VR grass heigth found
No TZ Tree DBH found
Water Potential - mode: raw
| Time | Species | Tree | readings (bar) |
|---|
| 2008-05-31 15:08:00 |
OAK |
92 |
-25.5 |
-25.5 |
|
-27.5 |
| 2008-05-31 15:25:00 |
OAK |
255 |
-25.5 |
-28 |
|
-28.5 |
| 2008-05-31 15:33:00 |
OAK |
102 |
-29 |
-28 |
|
-25.5 |
No TZ Grass Biomass data found
No TZ OakLeaves Biomass data found
No TZ PineNeedles Biomass data found
0 photos found
16 sets found
No data found for TZ_Fenergy.
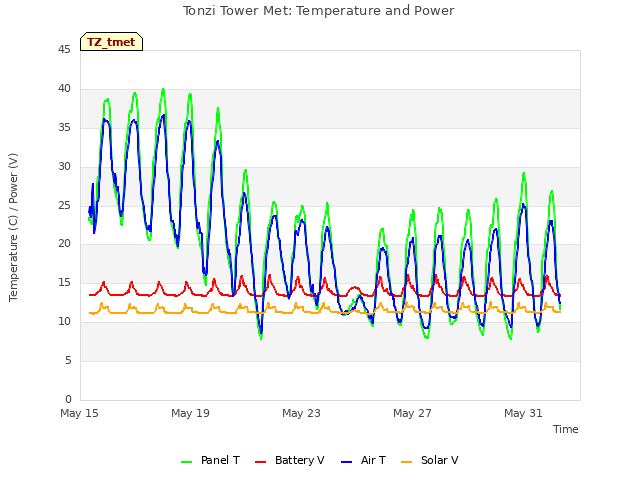
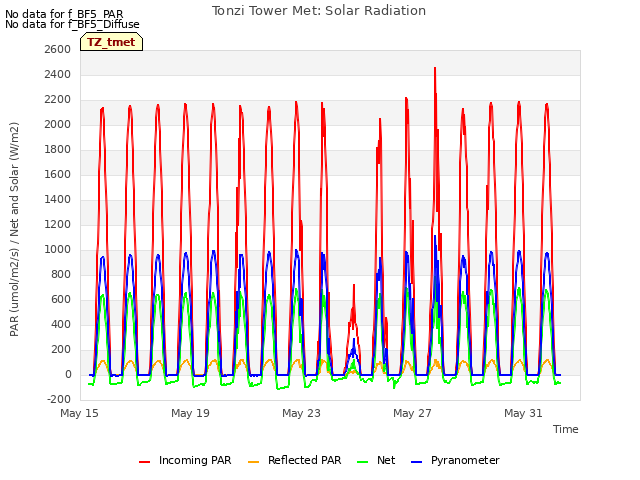
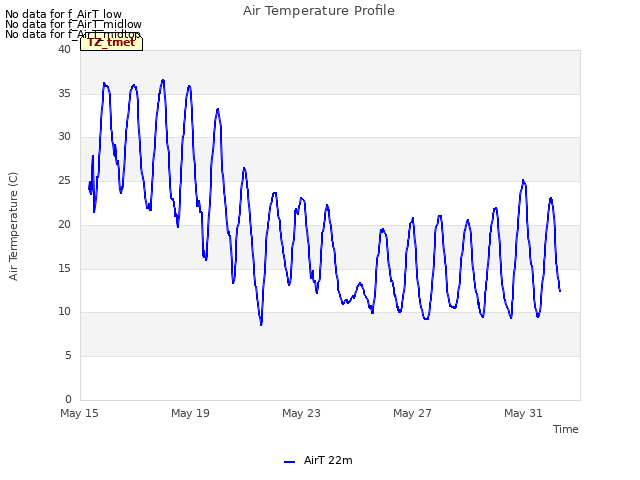
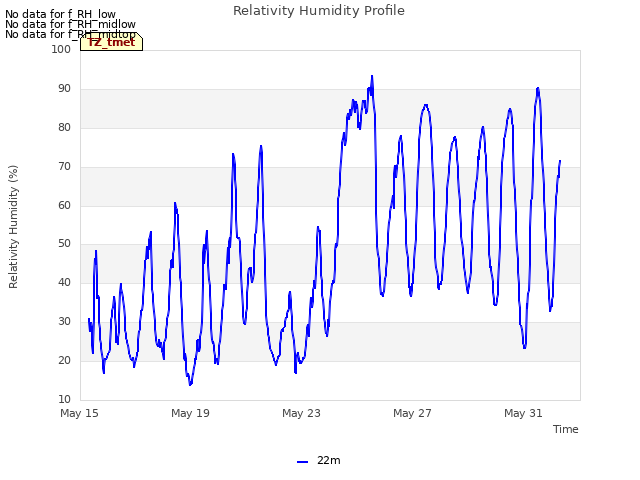
11 TZ_tmet graphs found


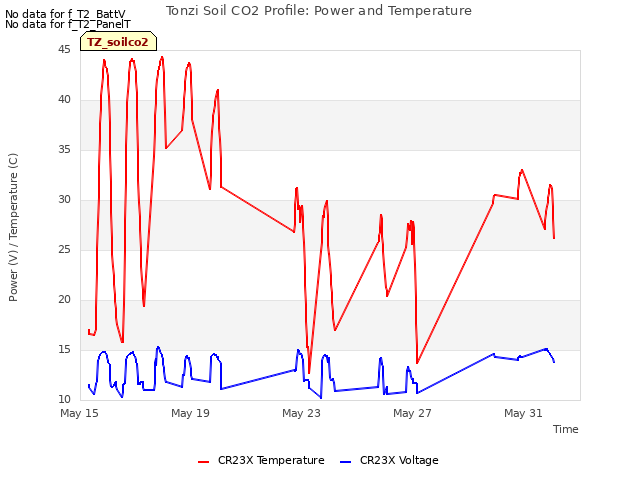
11 TZ_soilco2 graphs found


Can't check TZ_mixed
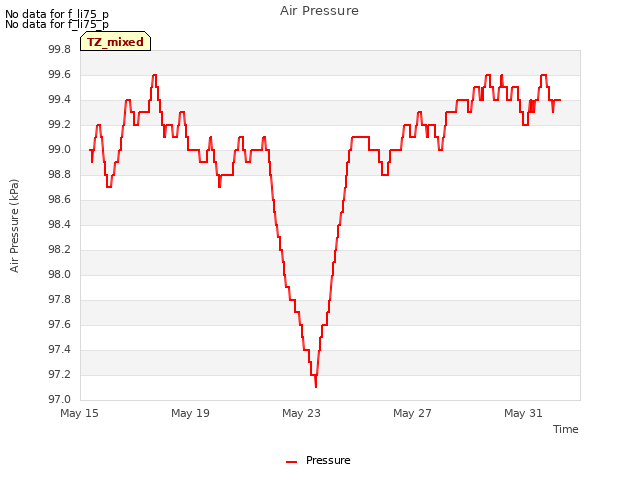
3 TZ_mixed graphs found

No data found for TZ_fflux.
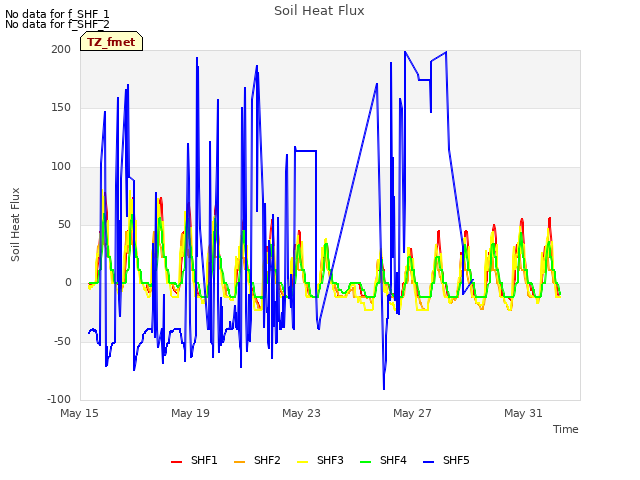
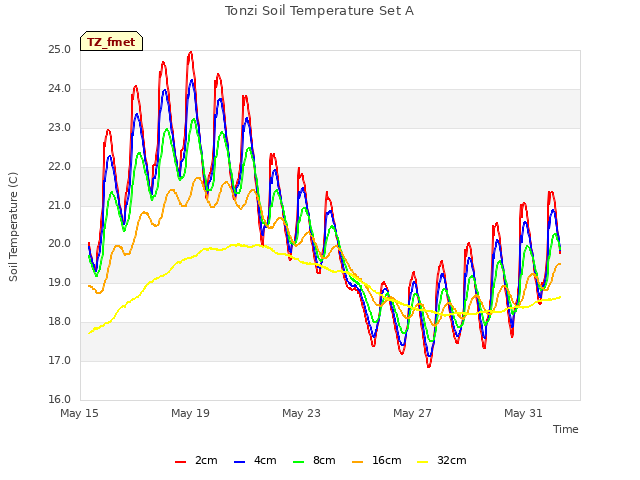
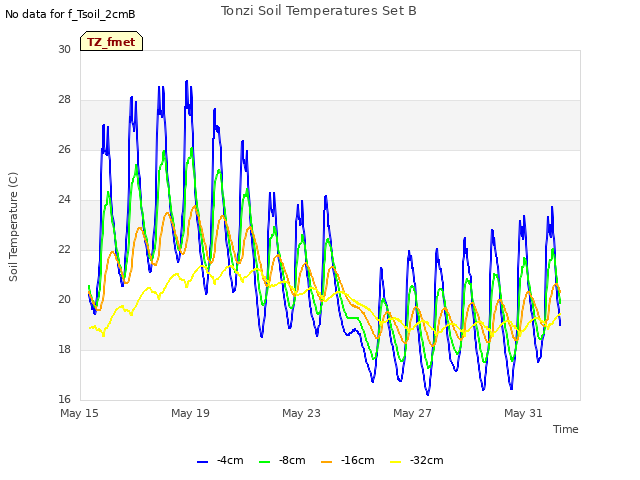
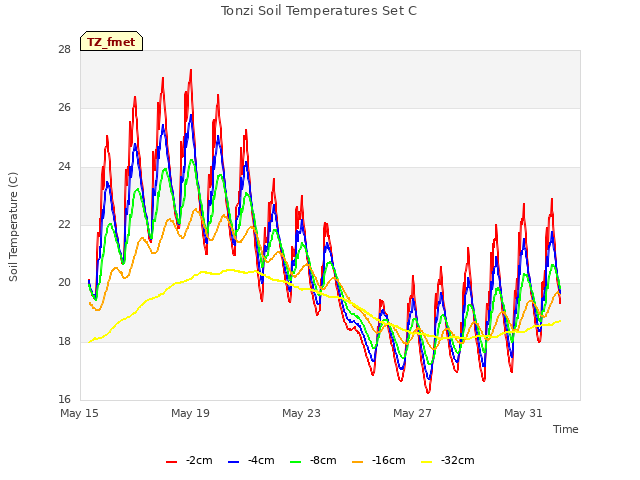
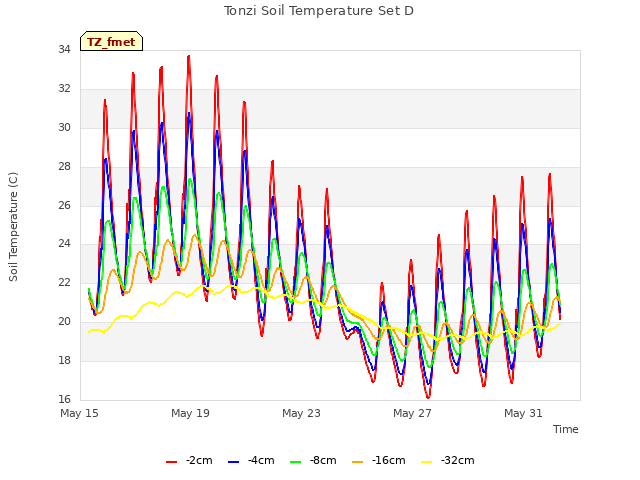
8 TZ_fmet graphs found


No data found for TZ_tram.
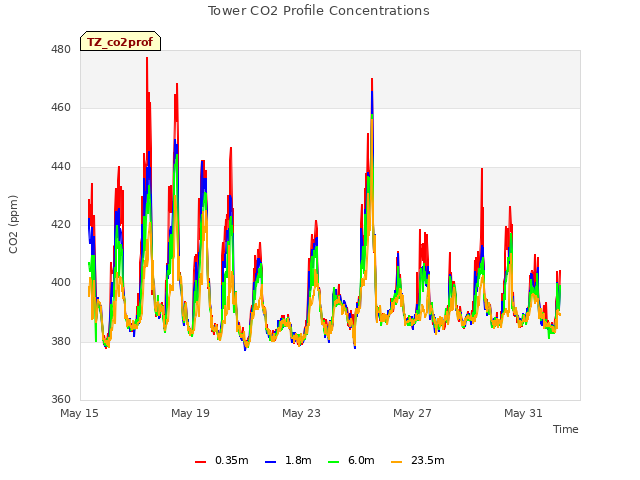
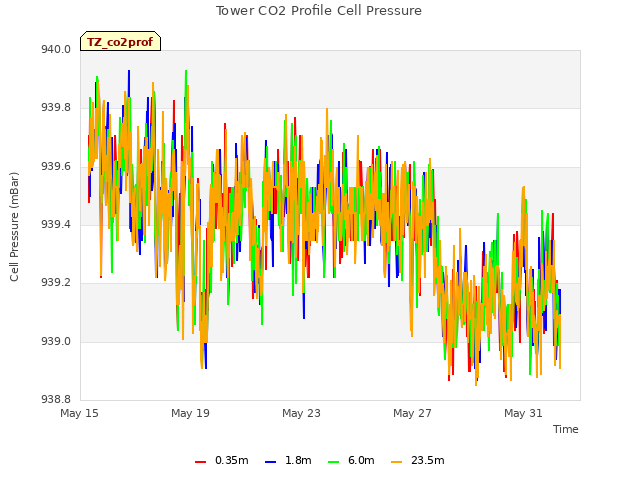
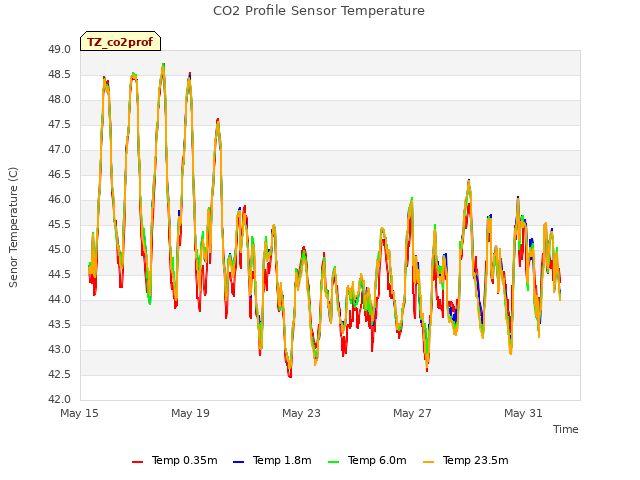
3 TZ_co2prof graphs found
No data found for TZ_irt.
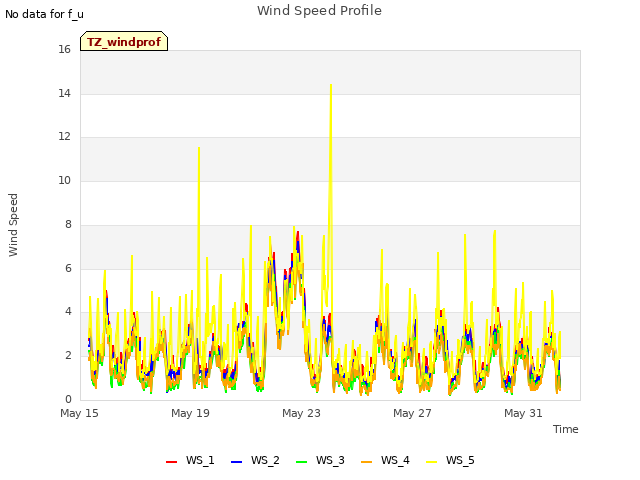
1 TZ_windprof graphs found
No data found for TZ_tflux.
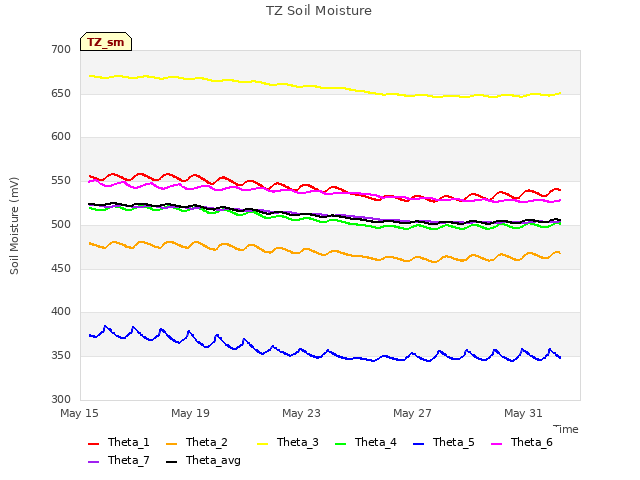
2 TZ_sm graphs found

Can't check TZ_met
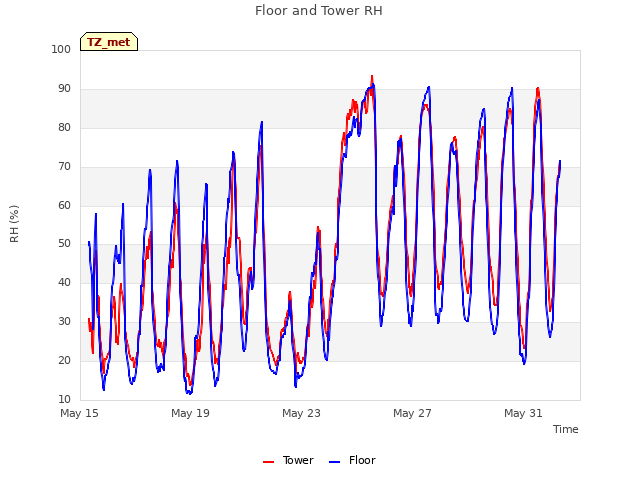
1 TZ_met graphs found
Can't check TZVR_mixed
No data found for TZ_osu.
No data found for TZ_fd.
Tonzi Z-cam data


