Field Notes
<--2008-04-04 11:00:00 |
2008-05-06 00:00:00-->
Phenocam link:
Searching...Tonzi: 2008-04-20 05:30:00 (DOY 111)
Author: Siyan Ma
Others: Xingyuan
When: Datae 4/20/2008 , Day:
111 ,
Watch Time: 5:30am .
Where: Tonzi/Vaira Ranch
Who: Siyan and Xingyuan
Weather:
clear, windy, cold
Phenology
- Grasses
at Vaira and Tonzi have passed leaf developing period.
- Grasses
at Tonzi looked greener than those at Vaira.
- Grasses
at Vaira started turning to yellow.
- TDR
probes showed that the top three layers were pretty dry already. The forth layer looked OK, around 40%.
Summary
- The first pre-dawn and mid-day water potential this year. The pre-dawn values were around 1 – 5
bar.
- EC systems worked well, and
data were downloaded. Notice that power juice wasn’t enough
for turning on the screen in the early morning. We may need put two more batteries on
the floor site.
- grass samples for LAI and
phenology in Tower and Vaira, oak branches for N
- soil moisture measurement
- dendrometer readings
- spectrometer measurement at
Vaira and Tonzi.
Vaira_Grass
Site
- Fence and gate power: >12 v.
- Panel and Batteries: 14.0 v; amps; amps.
- Reading from Gillsonic screen
before downloading data. (The value
of H2O and CO2 should be in the range of 0 – 5 v.)
Time
|
|
Path/File name
|
D:\Data\V08_111 .flx
D:\Data\VR08 .raw
|
|
mean
|
std
|
|
mean
|
std
|
w
|
0..14
|
0.359
|
Ts
|
11.1
|
4.587
|
u
|
2.22
|
1.488
|
H2O
|
1.48
|
0.04
|
v
|
0.27
|
6.489
|
CO2
|
2.01
|
0.043
|
|
|
|
Tc
|
0.832
|
0.12
|
- downloading data YES!
- check the fans of air temp.
and relative humidity sensors at Vaira.
YES!
- Check MD-9 system connections:
YES!
- Check levels of Radiation
sensors, clear up surfaces. YES!
- Clean up the rain gage: YES!
- Closed gate and set up fence.
YES!
Tonzi_Tower Site
- Fence and gate power: >12 v.
- Panel and Batteries: 12.0 v; 0.0 amps; 5.9 amps.
- Reading from Gillsonic screen
before downloading data. (The value
of H2O and CO2 should be in the range of 0 – 5 v.)
Time
|
|
Path/File name
|
D:\Data\T08_
111 .flx
D:\Data\TW08 .raw
|
|
mean
|
std
|
|
mean
|
std
|
w
|
-0.32
|
0.312
|
Ts
|
7.938
|
0.332
|
u
|
-2.88
|
0.516
|
H2O
|
1.637
|
0.006
|
v
|
1.63
|
0.427
|
CO2
|
2.162
|
0.009
|
- downloading data YES!
- check the fans of air temp.
and relative humidity sensors on the tower and the floor. YES!
- Check calibration cylinders;
CO 2 1700 psig; flow 20
psi.
N 2 1700
psig; flow 20 psi.
Manually calibrate Li-800. Following Ted’s instruction: H:\IoneSavanna_2004\Tower_2004\CO2Profile\LI800_Calibration_Procedure_2Nov04.txt
Is the pump running
- close gate and set up fence. YES!
Toniz_Floor
Site
- Fence and gate power: 12
v.
- Panel and Batteries: 12.4 v; 0.8 amps; 2.2 amps. (9:00am)
- Reading from Gillsonic screen
before downloading data. (The value
of H2O and CO2 should be in the range of 0 – 5 v.)
Time
|
|
Path/File name
|
D:\Data\F08_
111 .flx
D:\Data\FL08
.raw
|
|
mean
|
std
|
|
mean
|
std
|
w
|
0.07
|
0.046
|
Ts
|
4.34
|
0.16
|
u
|
0.22
|
0.141
|
H2O
|
1.46
|
0.078
|
v
|
-0.:83
|
0.13
|
CO2
|
2.28
|
0.011
|
- downloading data: YES!
- Check MD-9 system connections
CR23X3 – floor-Met
CR23X5 – soil CO 2
profile
CR23X6 – tower-Met
CR10X2 – floor-Met
CR10X4 – sap-flow
CR10X7 – CO 2 profile
CR10X8 – wind profile
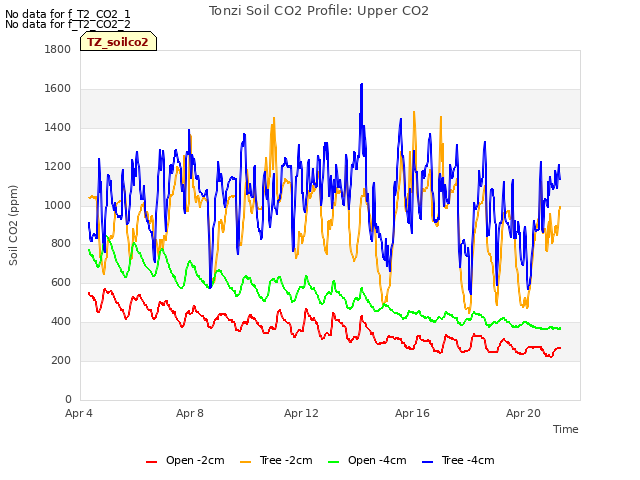
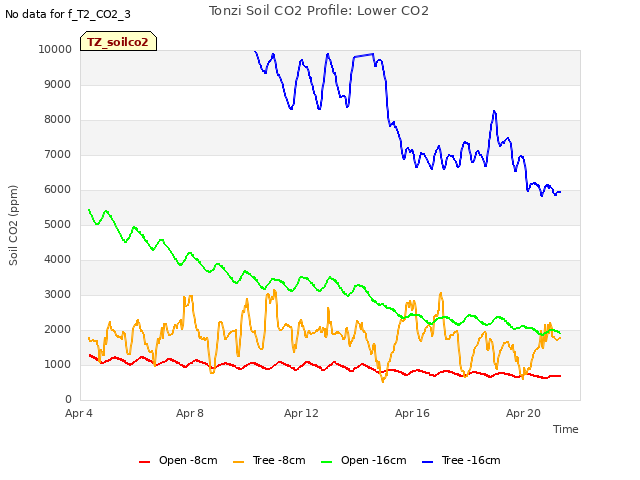
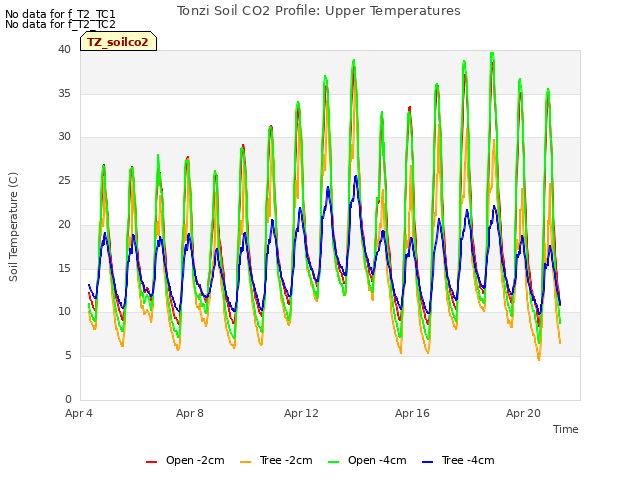
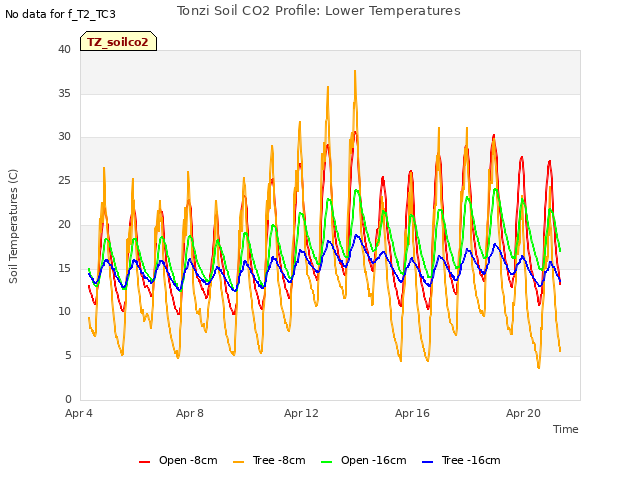
- Soil CO2 profile
Reading
from datalogger
Panel
temp
|
3.1
|
|
|
Battery
voltage
|
12.1
|
|
|
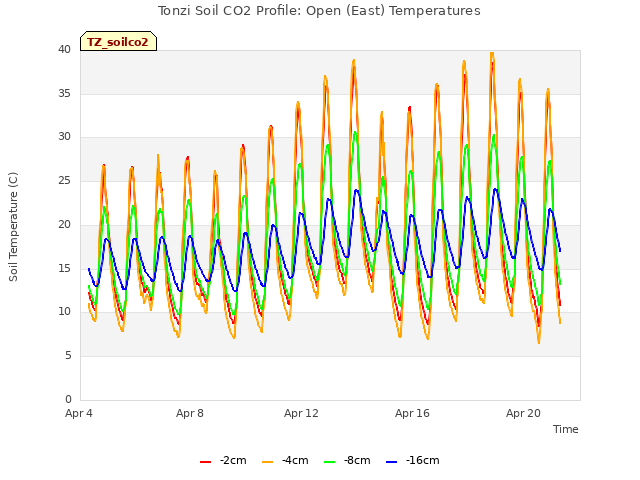
CO2E_1
|
262
|
TCE_1
|
10
|
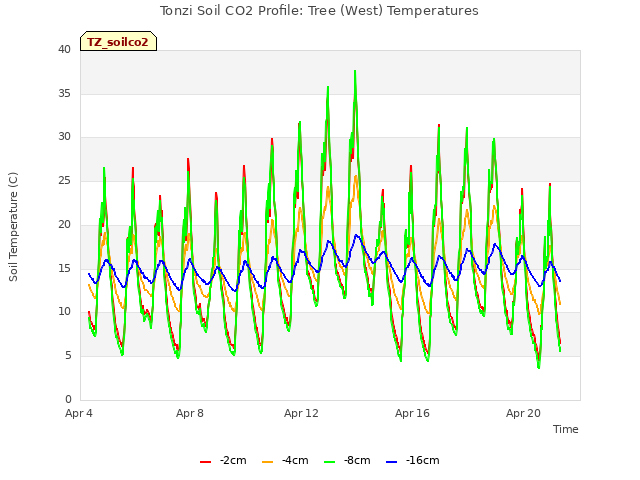
CO2W_1
|
1155
|
TCW_1
|
9.3
|
CO2E_2
|
367
|
TCE_2
|
9.6
|
CO2W_2
|
1238
|
TCW_2
|
31
|
CO2E_3
|
651
|
TCE_3
|
12
|
CO2W_3
|
2040
|
TCW_3
|
9.4
|
CO2E_4
|
940
|
TCE_4
|
15
|
CO2W_4
|
2930
|
TCW_4
|
13.6
|
Reading
from panels of analyzers
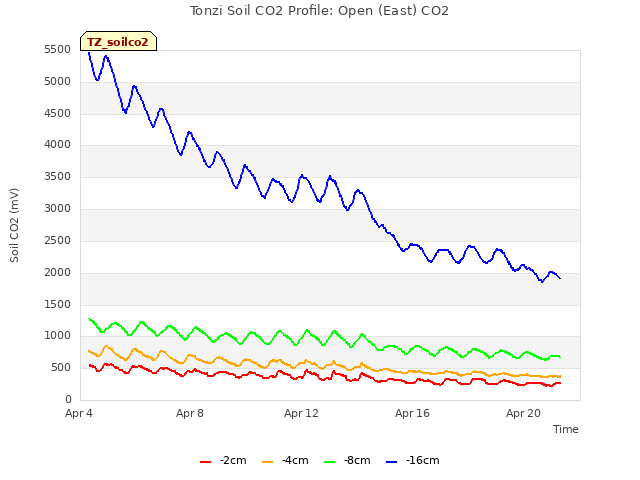
depth
|
Open
|
order
|
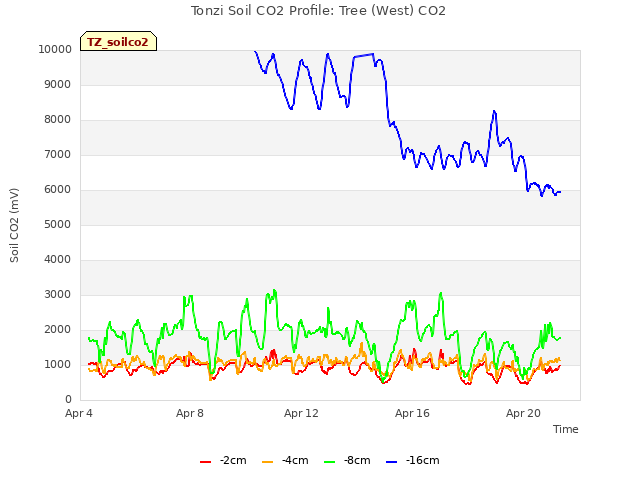
depth
|
Tree
|
order
|
2cm
(1%)
|
540
|
1
|
2cm
(1%)
|
2220
|
1
|
4cm
|
740
|
2
|
4cm
|
2330
|
2
|
8cm
|
1320
|
3
|
8cm
|
3850
|
3
|
16cm
|
1900
|
4
|
16cm
|
5870
|
4
|
- Close gate and set up fence. YES!
tonzi
|
7931AFE
|
402165
|
574B4B
|
402FF3
|
574632
|
7A432E
|
7A3C6E
|
7A3B40
|
7A4AAA
|
20-Apr-08
|
111
|
|
|
|
|
|
|
|
|
|
SM
|
|
|
|
|
|
|
|
|
0-15
|
10.3
|
9.3
|
16.5
|
9.6
|
11.7
|
8.7
|
10.1
|
11.3
|
8.2
|
15-30
|
16.8
|
15.0
|
12.6
|
16.3
|
12.1
|
9.6
|
14.8
|
20.7
|
8.2
|
30-45
|
25.8
|
26.3
|
19.9
|
23.9
|
18.3
|
15.6
|
18.2
|
24.3
|
23.6
|
45-60
|
29.4
|
38.2
|
23.5
|
45.6
|
34.4
|
19.3
|
20.9
|
40.4
|
18.6
|
|
|
|
|
|
|
|
|
|
|
|
A6D882B
|
A3D04E8
|
A6D72F5
|
|
|
|
|
|
|
|
|
|
|
|
|
|
|
|
|
0-15
|
15.0
|
11.3
|
4.4
|
|
|
|
|
|
|
15-30
|
11.5
|
11.2
|
14.1
|
|
|
|
|
|
|
30-45
|
23.5
|
23.1
|
17.9
|
|
|
|
|
|
|
45-60
|
31.9
|
34.8
|
29.7
|
|
|
|
|
|
|
|
|
|
|
|
|
|
|
|
|
vaira
|
57318a
|
7933dee
|
|
|
|
|
|
|
|
0-15
|
2.6
|
3.7
|
|
|
|
|
|
|
|
15-30
|
11.5
|
12.0
|
|
|
|
|
|
|
|
30-45
|
17.6
|
18.3
|
|
|
|
|
|
|
|
45-60
|
21.9
|
25.0
|
|
|
|
|
|
|
|
Tonzi
|
|
|
|
Dendrometer
|
|
|
|
|
|
|
Date
|
Day
|
Tag #
|
Reading (cm)
|
4/20/2008
|
111
|
71
|
x
|
|
|
72
|
9.8
|
|
|
77
|
Broken
|
|
|
78
|
Broken
|
|
|
79
|
12.5
|
|
|
245
|
4.7
|
|
|
248
|
14
|
|
|
250
|
10.1
|
|
|
255
|
X
|
|
|
252
|
X
|
|
|
102
|
4.9
|
Sample sheet for MIBA
Sample vial
|
What
|
MIBA-US-01.178
|
Leave 1
|
MIBA-US-01. 179
|
Leave 2
|
MIBA-US-01. 180
|
Grass 1
|
MIBA-US-01. 181
|
Grass 2
|
MIBA-US-01. 182
|
Soil in 10 cm
|
MIBA-US-01. 183
|
Stem 1
|
MIBA-US-01. 184
|
Stem 2
|
|
Field Data
No tank data
Well Depth
| Date | Location | Depth (feet) |
|---|
| 2008-04-20 | TZ_floor | 25.4 |
| 2008-04-20 | TZ_road | 34.6 |
| 2008-04-20 | TZ_tower | 29.46 |
No TZ Moisture Point data found
No VR Moisture Point data found
No TZ grass heigth found
No VR grass heigth found
No TZ Tree DBH found
Water Potential - mode: raw
| Time | Species | Tree | readings (bar) |
|---|
| 2008-04-20 05:50:00 |
OAK |
102 |
-1 |
-3 |
-3.5 |
| 2008-04-20 06:00:00 |
OAK |
255 |
-5 |
-5 |
-3 |
| 2008-04-20 06:06:00 |
OAK |
92 |
-3 |
-3 |
-1 |
| 2008-04-20 14:32:00 |
OAK |
102 |
-9.5 |
-7.5 |
-8.5 |
| 2008-04-20 14:38:00 |
OAK |
255 |
-12 |
-11.5 |
-10.5 |
| 2008-04-20 14:44:00 |
OAK |
92 |
-11 |
-18 |
-15 |
No TZ Grass Biomass data found
No TZ OakLeaves Biomass data found
No TZ PineNeedles Biomass data found
0 photos found
16 sets found
No data found for TZ_Fenergy.
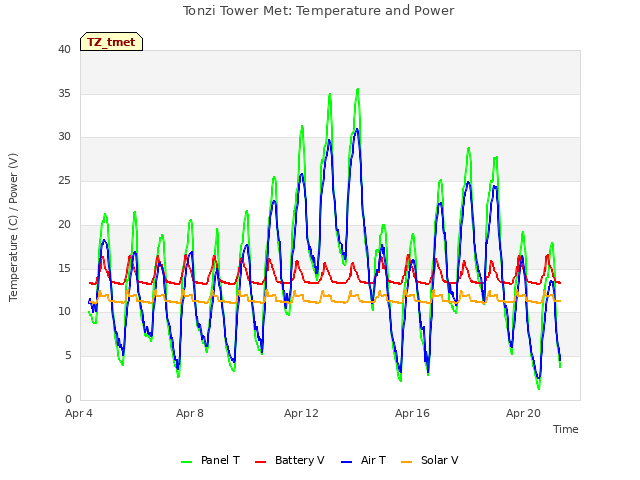
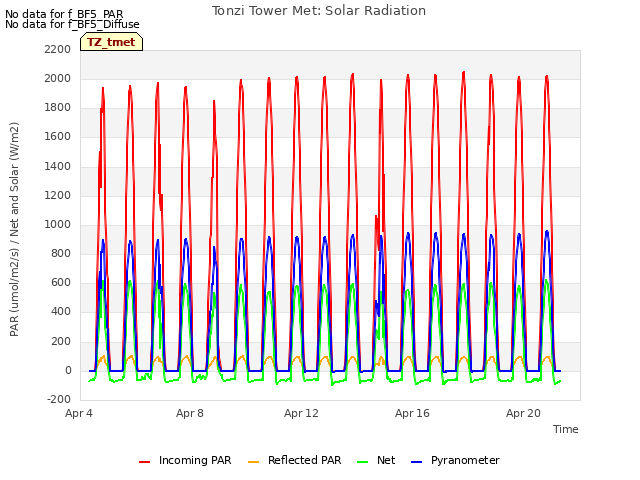
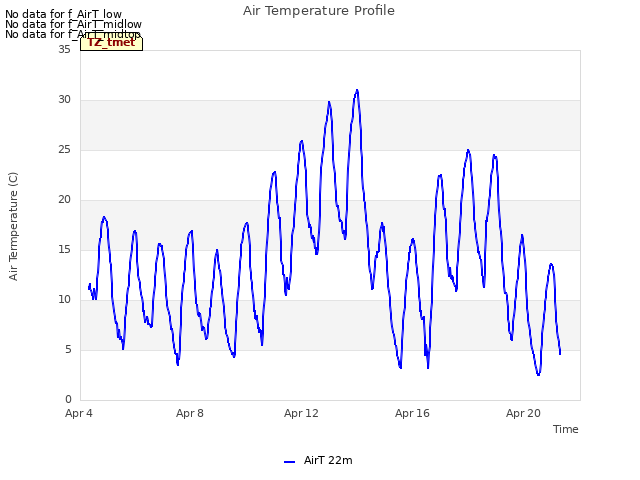
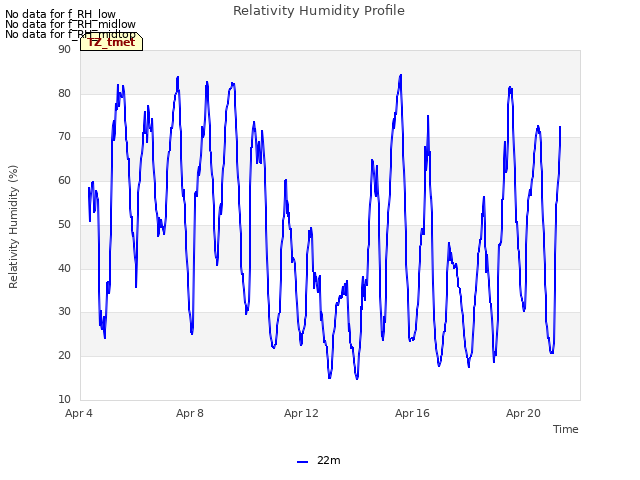
11 TZ_tmet graphs found


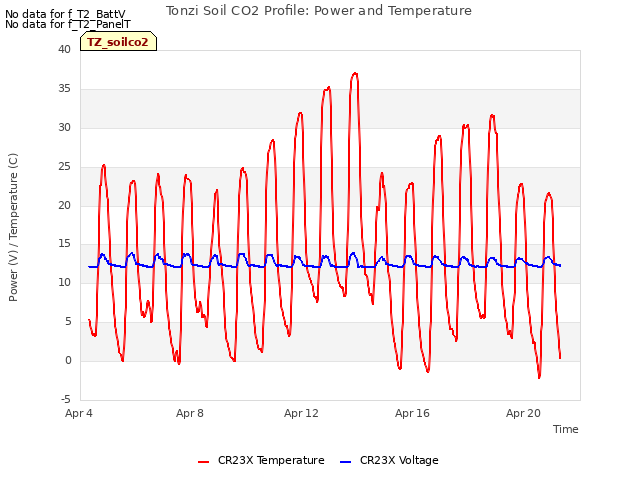
11 TZ_soilco2 graphs found


Can't check TZ_mixed
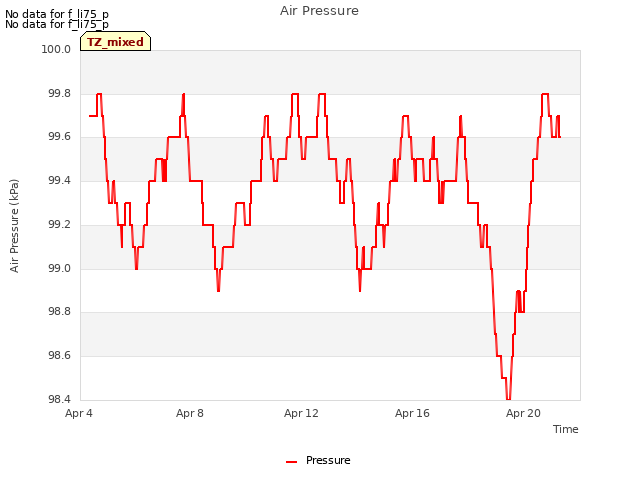
3 TZ_mixed graphs found

No data found for TZ_fflux.
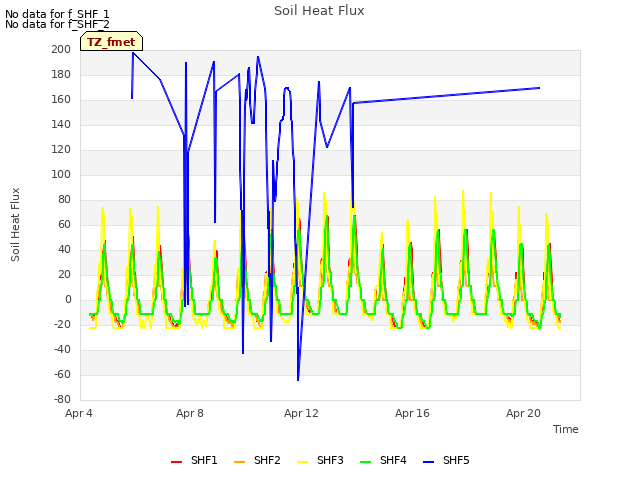
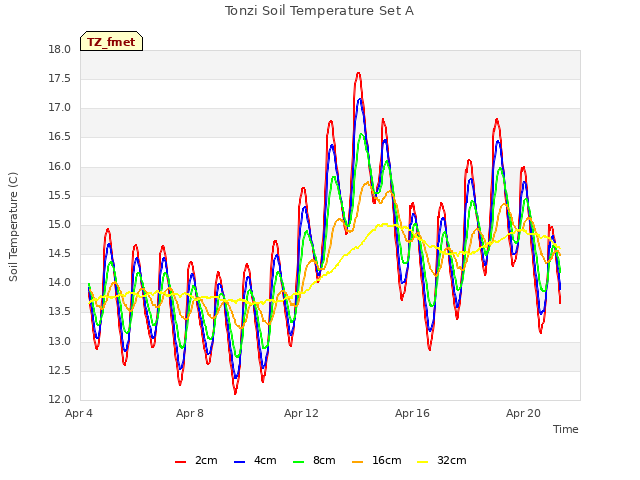
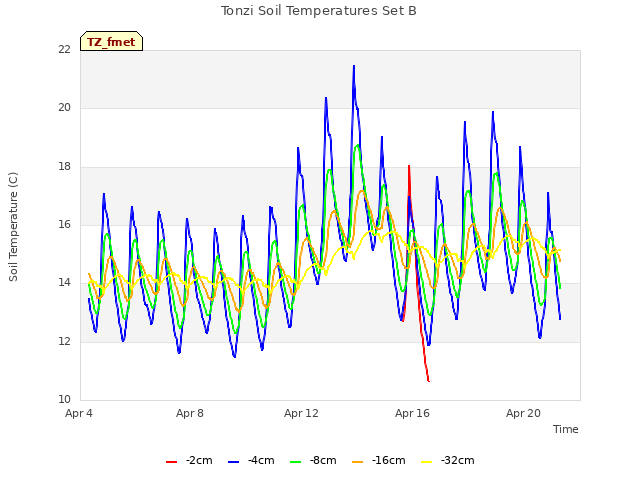
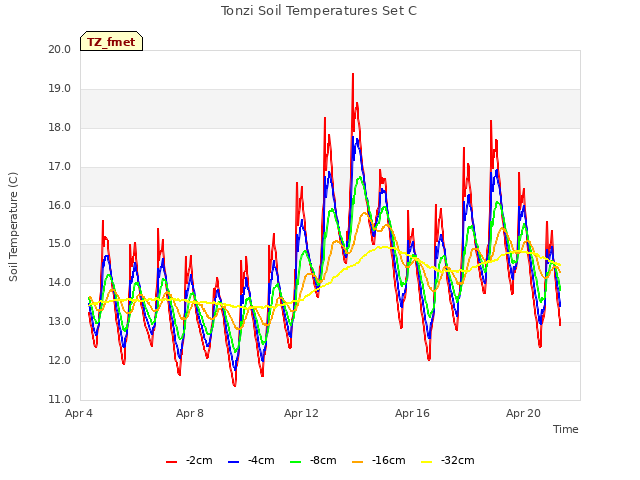
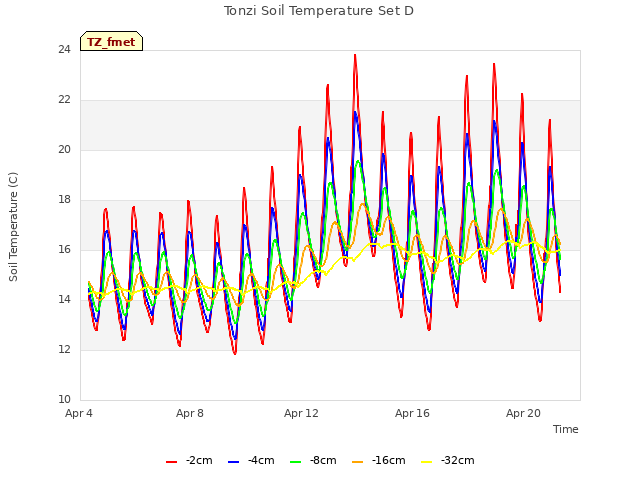
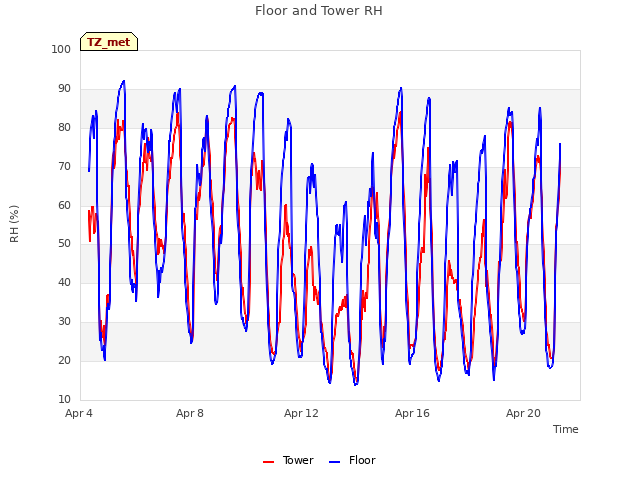
8 TZ_fmet graphs found


No data found for TZ_tram.
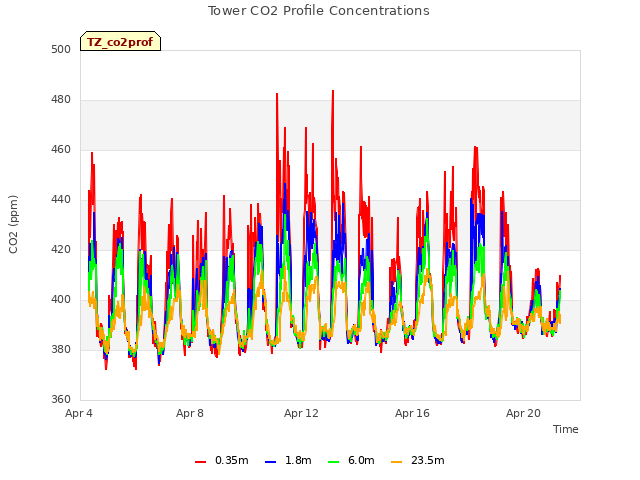
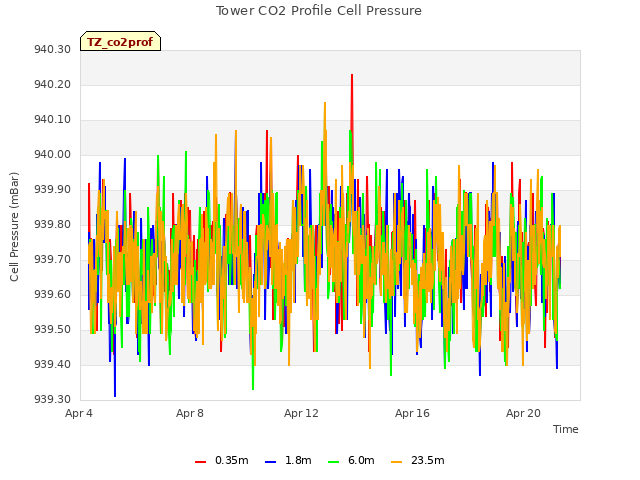
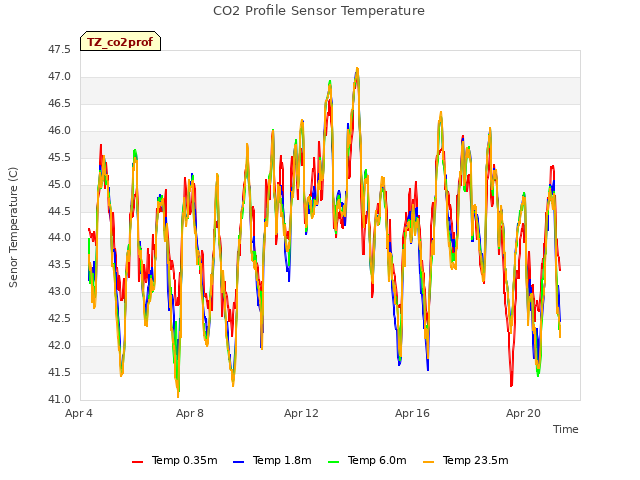
3 TZ_co2prof graphs found
No data found for TZ_irt.
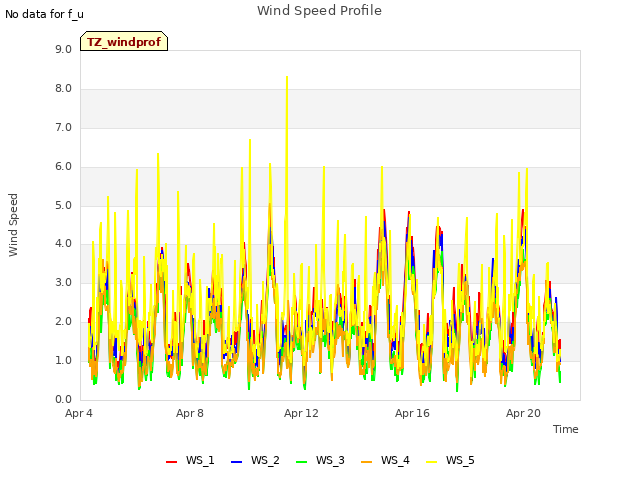
1 TZ_windprof graphs found
No data found for TZ_tflux.
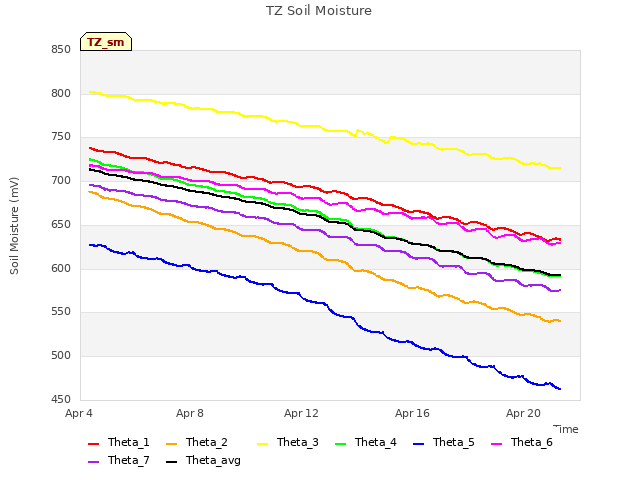
2 TZ_sm graphs found

Can't check TZ_met
1 TZ_met graphs found
Can't check TZVR_mixed
No data found for TZ_osu.
No data found for TZ_fd.
Tonzi Z-cam data


