
Site: Sherman Wetland (SW) aka US-Sne
2016-05-24 - 2021-09-02
A new restored wetland on the old Sherman Pasture site. The new tower is about 67m northwest (300deg) of the old tower site (US-Snd). On Jan 30, 2020 a temporary tower was set up in the western portion of Sherman Wetland to capture the more vegetated areas and compare with the main tower.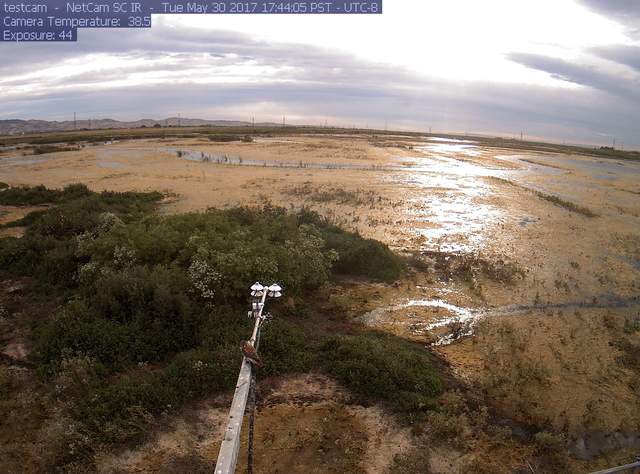
Last field site visit: more fieldnotes
| 2022-11-18 11:00:00 | Remove all sampling equipment from hotspot location, 1 boardwalk and 3 cinder blocks stashed at the main SW boardwalk |
Latest data processing: more processing notes
| 2021-01-23 | TEMPORARY TOWER - Met, L1 L2 L3 - Last Processing for dates: 2020-09-10 - 2020-11-11 |
| Processor of record: 2016-06-09 - Kyle Hemes 2019-07-30 - Robert Shortt 2020-02-24 - Daphne Szutu 2020-04-03 - Alex Valach 2021-01-23 - Ariane Arias-Ortiz |
Ameriflux Author:
20160524 - Kyle Hemes 20160524 - Joseph Verfaillie 20160524 - Dennis Baldocchi 20161200 - Daphne Szutu 20190714 - Robert Shortt |
Data Digital Object Identifier (DOI)
AmeriFlux: https://doi.org/10.17190/AMF/1418684
FLUXNET: https://doi.org/10.17190/AMF/1871144
FLUXNET-CH4: https://doi.org/10.18140/FLX/1669693
Equipment Locations
more details
| Equipment | Start Date | End Date | X | Y | Z | Notes |
|---|---|---|---|---|---|---|
| Anemometer | 2016-05-24 | - | -0.19 | 0.26 | 5.61 | Heading=9 |
| 2017-07-03 | - | Heading=4 | ||||
| 2020-01-30 | 2020-11-12 | 4.76 | Heading=29 | |||
| 2021-03-25 | 2021-05-13 | Heading=10 | ||||
| 2021-05-13 | - | Heading=17 | ||||
| Anemometer Cal | 2021-03-25 | - | ||||
| Barometer | 2016-05-24 | - | 0 | -1.7 | 1.7 | |
| 2020-01-30 | 2020-11-12 | |||||
| Battery Bank | 2016-05-24 | - | ||||
| 2020-01-30 | 2020-11-12 | |||||
| Camera | 2016-06-06 | 2017-07-14 | 1.42 | -1.83 | 5.8 | |
| 2017-07-14 | - | 1.42 | -1.83 | 5.2 | Cut 60cm off top of post so that it doesn't shade the radiation sensors | |
| 2020-01-30 | 2020-11-12 | 3.37 | ||||
| CO2 Probe | 2016-05-24 | - | ||||
| 2020-01-30 | 2020-11-12 | |||||
| Conductivity Sensor | 2017-02-23 | - | ||||
| Data Logger Cal | 2021-02-26 | - | ||||
| Data Logger Diffuse PAR | 2017-07-14 | - | ||||
| Data Logger Met | 2016-05-24 | - | 0 | -1.6 | 2.2 | |
| 2020-01-30 | 2020-11-12 | |||||
| DO Sensor | 2018-05-10 | - | ||||
| Gas Analyzer CH4 | 2016-05-24 | - | 0.02 | 0.22 | 5.61 | |
| 2020-01-30 | 2020-11-12 | 4.65 | ||||
| Gas Analyzer CO2/H2O | 2016-05-24 | - | -0.05 | 0.05 | 5.515 | |
| 2020-01-30 | 2020-11-12 | 4.76 | ||||
| Heat Flux Plate A | 2016-05-24 | - | -5.07 | 1.74 | -0.02 | |
| 2020-01-30 | 2020-11-12 | |||||
| Heat Flux Plate B | 2016-05-24 | - | -3.4 | 3.53 | -0.02 | |
| 2020-01-30 | 2020-11-12 | |||||
| Heat Flux Plate C | 2016-05-24 | - | -5.84 | -2.16 | -0.02 | |
| Interface A547 | 2016-05-24 | - | ||||
| Interface LI-7550 | 2016-05-24 | - | 0 | -1.5 | 2.2 | |
| 2020-01-30 | 2020-11-12 | |||||
| Interface NL115 | 2016-06-02 | - | ||||
| Multiplexer Met | 2016-05-24 | - | 0 | -1.6 | 2 | |
| 2020-01-30 | 2020-11-12 | |||||
| Multiplexer Thermocouple | 2016-05-24 | - | 0 | -1.45 | 2.1 | |
| 2020-01-30 | 2020-11-12 | |||||
| Narrow Band NDVI Incoming | 2016-05-24 | - | -1.88 | -2.19 | 4.42 | NDVI in |
| 2020-01-30 | 2020-11-12 | |||||
| Narrow Band NDVI Reflected | 2016-05-24 | - | -1.88 | -2.19 | 4.32 | NDVI out |
| 2020-01-30 | 2020-11-12 | |||||
| Narrow Band PRI Incoming | 2016-05-24 | - | -1.88 | -2.16 | 4.42 | PRI in |
| Narrow Band PRI Reflected | 2016-05-24 | - | -1.88 | -2.16 | 4.32 | PRI out |
| Net Radiometer 4-way | 2016-05-24 | - | -2.33 | -2.16 | 4.37 | |
| 2020-01-30 | 2020-11-12 | 3.61 | ||||
| Net Radiometer 4-way Cal A | 2021-02-26 | - | ||||
| Net Radiometer 4-way Cal B | 2021-02-26 | - | ||||
| PAR Sensor Diffuse | 2017-07-14 | - | ||||
| PAR Sensor Incoming | 2016-05-24 | - | -1.74 | -2.08 | 4.42 | in |
| 2020-01-30 | 2020-11-12 | 3.7 | ||||
| PAR Sensor Reflected | 2016-05-24 | - | -1.74 | -2.08 | 4.32 | out |
| 2020-01-30 | 2020-11-12 | 3.56 | ||||
| Precipitation | 2016-05-24 | - | -1.2 | 1.62 | 1.5 | |
| RH & Temp | 2016-05-24 | - | 0.17 | 0.18 | 5.22 | |
| 2020-01-30 | 2020-11-12 | 4.32 | ||||
| Solar Controller | 2016-05-24 | - | ||||
| 2020-01-30 | 2020-11-12 | |||||
| Solar Panel A | 2016-05-24 | - | ||||
| 2020-01-30 | 2020-11-12 | |||||
| Solar Panel B | 2016-05-24 | - | ||||
| 2020-01-30 | 2020-11-12 | |||||
| Solar Panel C | 2020-01-30 | 2020-11-12 | ||||
| Thermocouple A +0.05m | 2016-05-24 | - | -5.57 | 1.44 | 0.05 | |
| Thermocouple A +0.10m | 2016-05-24 | - | -5.57 | 1.44 | 0.1 | |
| Thermocouple A +0.30m | 2016-05-24 | - | -5.57 | 1.44 | 0.3 | |
| Thermocouple A +0.50m | 2016-05-24 | - | -5.57 | 1.44 | 0.5 | |
| Thermocouple A 0.00m | 2016-05-24 | - | -5.57 | 1.44 | 0 | |
| Thermocouple B +0.05m | 2016-05-24 | - | -3.1 | 3.73 | 0.05 | |
| Thermocouple B +0.10m | 2016-05-24 | - | -3.1 | 3.73 | 0.1 | |
| Thermocouple B +0.30m | 2016-05-24 | - | -3.1 | 3.73 | 0.3 | |
| Thermocouple B +0.50m | 2016-05-24 | - | -3.1 | 3.73 | 0.5 | |
| Thermocouple B 0.00m | 2016-05-24 | - | -3.1 | 3.73 | 0 | |
| Thermocouple C1 -0.02m | 2016-05-24 | - | -5.41 | -1.51 | -0.02 | |
| Thermocouple C1 -0.08m | 2016-05-24 | - | -5.41 | -1.51 | -0.08 | |
| Thermocouple C1 -0.16m | 2016-05-24 | - | -5.41 | -1.51 | -0.16 | |
| Thermocouple C1 -0.32m | 2016-05-24 | - | -5.41 | -1.51 | -0.32 | |
| Thermocouple C2 -0.02m | 2016-05-24 | - | -5.19 | -2.31 | -0.02 | |
| Thermocouple C2 -0.08m | 2016-05-24 | - | -5.19 | -2.31 | -0.8 | |
| Thermocouple C2 -0.32m | 2016-05-24 | - | -5.19 | -2.31 | -0.32 | |
| Water Level | 2016-05-24 | 2018-11-01 | -0.68 | -3.09 | -0.84 | Freshly installed |
| 2018-11-01 | 2019-06-10 | -0.68 | -3.09 | -0.52 | Sensor accidentally moved when measuring depth | |
| 2019-06-10 | 2020-08-28 | -0.68 | -3.09 | -0.46 | Mysterious change in the middle of the night | |
| 2020-01-30 | 2020-11-12 | -0.73 | ||||
| 2020-08-28 | - | -0.68 | -3.09 | -0.45 | Freshly installed | |
| Weather Station | 2019-07-02 | - |
Data Streams:
more data
| Code | First Day | Last Day | Description |
|---|---|---|---|
| SW_arable | 2019-07-02 | 2021-09-02 | Data from an Arable Mark I unit at SW. 30min averages were calculated from the raw 5min data until the API changed and only 60min data was available after 2020-06-04. |
| SW_cam | 2016-06-06 | 2021-09-02 | Digital number data from Pheoncamera at Sherman Wetland Phenocam archive |
| SW_flux | 2016-05-24 | 2021-09-02 | 30min averages of the raw high frequency eddy data |
| SW_met | 2016-05-24 | 2021-09-02 | 30 min averages of data from biomet sensors |
| SW_minidot | 2018-05-10 | 2021-09-02 | Dissolved oxygen from the minidot sensor at the tower |
| SW_processed | 2016-05-24 | 2021-09-02 | Data loaded from the Level 1 processed data including fluxes and turbulence data |
| SW_processed3 | 2016-05-24 | 2021-09-02 | Gap filled and partitioned data from Level 3 processing files |
| SW_t1cam | 2020-01-30 | 2020-11-12 | Digital number data from autocam imagery (raspberry pi zero w) from temporary tower 1250m upwind of the Sherman Wetland permanent tower. |
| SW_t1flux | 2020-01-30 | 2020-11-12 | 30min averages of the raw high frequency eddy data from temporary tower 1250m upwind of the Sherman Wetland permanent tower. |
| SW_t1met | 2020-01-30 | 2020-11-12 | Met data from micro-met sensors at temporary tower 1250m upwind of the Sherman Wetland permanent tower. |
Metadata and Data Sets:
more data
| Id | Type | Site | Dates | Frequency | Title | Description |
|---|---|---|---|---|---|---|
| 12 | Isotope | SW | 2017-06-01 - Present | 30 min | Patty's LGR CO2 and H2O Isotope Laser | Installed June 2017. |
| 10 | Leaf Level | EE, WP, SW | 2017-07-12 - 2018-06-26 | Handful of dates | LI-6400 measurements of Tule and Cattail | Leaf level measurements of tule and cattails including at least one 24 hour measurement period. More details needed here. |
| 26 | Lidar | BA, BC, EE, MB, SB, SW, TA, WP | 2016-12-01 - 2017-03-07 | Once | Delta-wide USGS Lidar flight | Winter time Lidar flight commissioned by the USGS and flown by Woolpert. Horizontal datum: NAD83 (NSRS2007) Epoch 2017.95, UTM Zone 10N, meters. Vertical datum: NAVD88, GEOID12B, US Survey Feet, Orthometric. Includes classified point cloud, features shape files, bare earth DEM, orthometric imagery (0.3-meter16-bit 4-band RGB-IR tiles in TIFF format with World Files). The entire Delta is covered by 8 points per m2, 0.5m DEM. |
| 3 | Lidar | BA, BC, WP, EP, EE, TA, TW, MB, SB, SW | 2018-09-20 | Once | NCALM Lidar Flight | Lidar flight data collection from Kyle Hemes NCAL project: Ecosystem Structure as a Driver of Climatic, Habitat, and Hydrological Services in Heterogeneous Restored Wetlands. Point clouds (*.las files), 1m resolution DEM and DSM (arcgis GridFloat files), visible imagery (*.tif files) of Sherman, Twitchel and Bouldin Islands. UTM Zone 10N, meters, NAD83(2011) epoch 2010.00 / NAVD88 (GEOID12B) |
| 11 | Report | SW | 2017-01-01 | every time processing | fixing nighttime uptake at SW | Sherman wetland (once pasture) was flooded winter 2016, and we sawuptake spikesat night -there wasno vegetation yet. |
| 13 | Report | SW | 2017-06-23 - 2017-08-02 | Once | 7550 configuration file correction –June to August 2017 | From 2017-06-23(DOY 174)to 2017-08-02 (DOY 214) an incorrect 7500 configuration file was running on the tower. We tried to back out the coefficients but could not determine what coefficients the data had been recorded with. We ended up generating a regression with the 30min data from MB and correction the 20Hz data with that regression. |
| 28 | Soils | SW | 2016-01-01 - 2016-05-30 | Once | Sherman Wetland preflood soil sampling | Dennis remembers Tyler Anthony take a whole bunch of samples (including bulk density measurements) right before we set up the tower in May 2016. Not sure where if we have the data or if Tyler has it. |
| 25 | Soils | SB, BC, EP, EE, BA, SW, MB | 2018-08-27 - 2018-08-28 | Once | Soil cores for C:N and microbial community | Soil samples were collected to be analyzed for soil moisture, bulk density, C:N, and microbial community. Generally at each site, two transects were sampled (T1 to the north, T2 south), starting near the tower and going to the west. Each transect had 5 sampling locations each (P1-P5), each location about 5m apart. At wetland locations (SW, MB, EE, EP, WP), soils were collected at 0-15cm depth. At agricultural locations (BA, BC, SB), soils were collected at 3 depths: 0-15cm, 15-30cm, and 30-60cm. For more information, see the field notes from each day. 2018-08-27 -Sherman Barn: The water table was around 50-60cm. -Bouldin Corn: Transects starting from the first corn rows running parallel away from the tower. Dry peat layer around 60 cm. -Bouldin Alfalfa: Transects starting roughly 5m from the tower. A smaller subsample was taken for microbial analysis. -East End: Transects starting 5-10m from the tower, going west/southwest through dense veg with the T2P4 and T2P5 taken from veg near the open water section. A smaller subsample was taken for microbial analysis. -East Pond: Transects starting about 7m from tower to the west (T1) and southwest (T2). (i.e. after the big open pond section by the solar panels). A smaller subsample was taken for microbial analysis. T2P5 was taken from the more uniformly vegetated area to the west. Other samples were mostly from fairly open water areas near clusters of veg. 2018-08-28 -Mayberry: Two transects (T1 in veg, T2 near the open water) each going northwest of the tower and took microbial subsamples from each core. -Sherman Wetland: We took two transects (T1 to the north, T2 south) going west from the tower starting where the water was about 20 cm deep and following the low vegetation. |
https://youtu.be/DexMs1DvBx4 - Timelapse of the set up of the Sherman Wetland site filmed with a Raspberry Pi camera.
SW 7550 Configuration file correction 2017 - Report on incorrect config file with 7500 swap, corrected using MB data.
HMP RH and AirT Comparison 12-2017
Delta SW PAR Comparison 10-2016
GCC comparision - Midday vs. Whole-day
Water Level sensor calibration with staff gauge
Sherman Wetland - NDVI (SRS, Arable, Planet)
Sherman Wetland Temp Tower - NDVI (SRS)
SW Soinc Compare