
Site: Bouldin Alfalfa (BA) aka US-Bi1
2016-08-12 - Present
An agricultural field in the San Joaquin Sacramento Delta. The field is a mix of organic peat and sediments and minerals from old river channels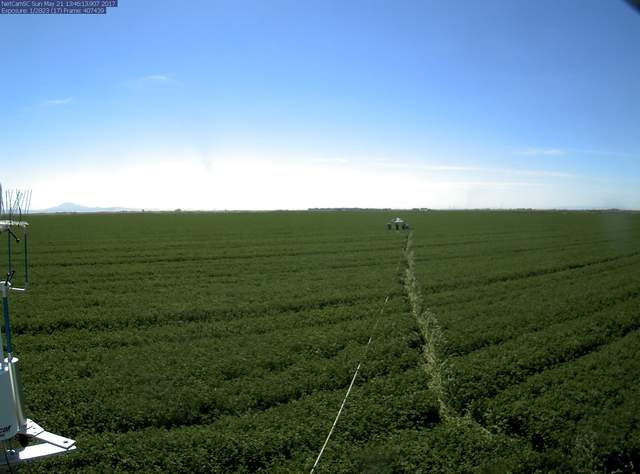
Last field site visit: more fieldnotes
| 2024-05-01 13:15:00 | Alfalfa mowed but not raked/baled, windy day |
Latest data processing: more processing notes
| 2024-01-09 | US-Bi1 quarterly processing for AmeriFlux for dates: 2023-09-06 - 2023-12-31 |
| Processor of record: 2016-10-27 - Sam Chamberlain 2017-12-17 - Daphne Szutu 2019-03-19 - Robert Shortt 2021-03-05 - Carlos Wang |
Ameriflux Author:
20160812 - Samuel D. Chamberlain 20160812 - Joseph Verfaillie 20160812 - Dennis Baldocchi 20161200 - Daphne Szutu 20190101 - Robert Shortt 20190200 - Camilo Rey-Sanchez 20210101 - Carlos Tianxin Wang |
Data Digital Object Identifier (DOI)
AmeriFlux: https://doi.org/10.17190/AMF/1480317
FLUXNET: https://doi.org/10.17190/AMF/1871134
FLUXNET-CH4: https://doi.org/10.18140/FLX/1669666
Equipment Locations
more details
| Equipment | Start Date | End Date | X | Y | Z | Notes |
|---|---|---|---|---|---|---|
| Anemometer | 2016-08-12 | 2016-08-16 | 0 | 0 | 3.92 | Heading=310 |
| 2016-08-16 | - | 0 | 0 | 3.92 | Heading=255 | |
| Anemometer Bouncer Lower | 2022-04-25 | 2022-11-02 | -248.5 | 61.8 | 2.46 | Heading=354 |
| 2022-11-02 | 2022-11-30 | 3.92 | Heading=329, moved to scaffolding for inter-compare 2nd from North | |||
| Anemometer Bouncer Upper | 2022-04-25 | 2022-11-02 | -248.5 | 61.8 | 3.96 | Heading=17 |
| 2022-11-02 | 2022-11-30 | 3.92 | Heading=231, moved to scaffolding for inter-compare 3rd from North | |||
| Anemometer Edge Lower | 2022-04-25 | 2022-11-02 | -425.6 | 110.7 | 2.46 | Heading=8 |
| 2022-11-02 | 2022-11-30 | 3.92 | Heading=327, moved to scaffolding for inter-compare 1st from North | |||
| Anemometer Edge Upper | 2022-04-25 | 2022-11-02 | -425.6 | 110.7 | 3.96 | Heading=70 |
| 2022-11-02 | 2022-11-30 | 3.92 | Heading=268, moved to scaffolding for inter-compare 4th from North | |||
| Anemometer Main Lower | 2022-04-25 | 2022-11-02 | 0.43 | 0.25 | 2.42 | Heading=2 |
| 2022-11-02 | 2022-11-30 | 3.92 | Heading=257, moved to scaffolding for inter-compare 6th from North | |||
| Anemometer Main Upper | 2022-04-25 | 2022-11-02 | -1 | 0 | 6.08 | Heading=327 |
| 2022-11-02 | 2022-11-30 | 3.92 | Heading=305, moved to scaffolding for inter-compare 5th from North | |||
| Anemometer Reflected | 2019-08-16 | 2019-09-04 | ||||
| Anemometer Tower Lower | 2021-07-20 | 2021-11-05 | 0.47 | 0.16 | 2.42 | Advection experiment, Heading=253deg |
| Anemometer Upper | 2019-08-16 | 2019-09-04 | ||||
| Anemometer Upwind Lower | 2021-07-20 | 2021-11-05 | -267 | 92 | 2.42 | Advection experiment, Heading=19deg |
| Anemometer Upwind Upper | 2021-07-20 | 2021-11-05 | -267 | 92 | 3.93 | Advection experiment, Heading=353deg |
| Barometer | 2016-08-12 | - | PRES-ElectBar | |||
| Battery Bank Bouncer | 2022-04-25 | 2022-11-02 | -248.5 | 61.8 | 0 | |
| Battery Bank Edge | 2022-04-25 | 2022-11-02 | -425.6 | 110.7 | 0 | |
| Camera | 2016-11-04 | - | 1.14 | 1.1 | 3.95 | |
| Data Logger Bouncer Flux | 2022-04-25 | 2022-11-02 | -248.5 | 61.8 | 1 | |
| 2022-11-02 | 2022-11-30 | 3 | Moved to main tower for intercomparison | |||
| Data Logger Bouncer Met | 2022-04-25 | 2022-11-02 | -248.5 | 61.8 | 1 | |
| Data Logger Edge Flux | 2022-04-25 | 2022-11-02 | -425.6 | 110.7 | 1 | |
| 2022-11-02 | 2022-11-30 | 3 | Moved to main tower for intercomparison | |||
| Data Logger Edge Met | 2022-04-25 | 2022-11-02 | -425.6 | 110.7 | 1 | |
| Data Logger Far | 2019-08-16 | 2019-09-04 | ||||
| Data Logger Main Flux | 2022-04-25 | 2022-11-30 | 1 | -1.7 | 3 | |
| Data Logger Met | 2016-08-12 | - | DL-CR1000 | |||
| Data Logger Near | 2019-08-16 | 2019-08-19 | ||||
| Data Logger Surface Renewal | 2021-06-16 | - | ||||
| Data Logger Upwind | 2021-07-20 | - | -267 | 92 | 1 | Advection experiment |
| Forced Diffusion A | 2018-07-12 | - | 0 | NE corner under scaffolding | ||
| Forced Diffusion B | 2020-04-17 | 2020-09-23 | 0 | SE corner under scaffolding | ||
| Gas Analyzer Bouncer CO2/H2O | 2022-04-25 | 2022-11-02 | -248.5 | 61.8 | 3.96 | |
| Gas Analyzer CH4 | 2016-08-12 | - | 0.2 | 0.13 | 3.8 | GA_OP-LI-COR LI-7700 |
| 2019-08-16 | 2019-09-04 | |||||
| Gas Analyzer CO2/H2O | 2016-08-12 | - | 0.15 | -0.09 | 9.92 | GA_OP-LI-COR LI-7500A |
| 2019-08-16 | 2019-09-04 | |||||
| Gas Analyzer Edge CO2/H2O | 2022-04-25 | 2022-11-02 | -425.6 | 110.7 | 3.96 | |
| Heat Flux Plate A | 2016-08-12 | - | -0.02 | SOIL_H-Plate | ||
| Heat Flux Plate B | 2016-08-12 | - | -0.02 | SOIL_H-Plate | ||
| Heat Flux Plate Bouncer A | 2022-04-25 | 2022-11-02 | -247.5 | 60.1 | -0.1 | |
| Heat Flux Plate Bouncer B | 2022-04-25 | 2022-11-02 | -247.5 | 60.1 | -0.1 | |
| Heat Flux Plate Bouncer C | 2022-04-25 | 2022-11-02 | -247.5 | 60.1 | -0.1 | |
| Heat Flux Plate C | 2016-08-12 | - | -0.02 | SOIL_H-Plate | ||
| Heat Flux Plate Edge A | 2022-04-25 | 2022-11-02 | -426.6 | 112.4 | -0.1 | |
| Heat Flux Plate Edge B | 2022-04-25 | 2022-11-02 | -426.6 | 112.4 | -0.1 | |
| Heat Flux Plate Edge C | 2022-04-25 | 2022-11-02 | -426.6 | 112.4 | -0.1 | |
| Infrared Temperature North | 2021-06-16 | - | 2.44 | |||
| Infrared Temperature South | 2021-06-16 | - | 2.52 | |||
| Interface Bouncer LI-7550 | 2022-04-25 | 2022-11-02 | -248.5 | 61.8 | 2 | |
| Interface Edge LI-7550 | 2022-04-25 | 2022-11-02 | -425.6 | 110.7 | 2 | |
| Interface LI-7550 | 2016-08-12 | - | INTERFACE | |||
| 2019-08-16 | 2019-09-04 | |||||
| LED sensor LED Sensor | 2017-02-01 | - | ||||
| Multiplexer Met | 2016-08-12 | - | MUX-AM16/32B | |||
| Multiplexer Thermocouple | 2016-08-12 | - | MUX-AM25T | |||
| Narrow Band NDVI Incoming | 2016-08-12 | - | 3.44 | -2.06 | 2.7 | SPECT-LED |
| Narrow Band NDVI Incoming Test | 2020-08-05 | - | 2.7 | Apogee S2-411 | ||
| Narrow Band NDVI Reflected | 2016-08-12 | - | 3.44 | -2.06 | 2.7 | SPECT-LED |
| Narrow Band NDVI Reflected Test | 2020-08-05 | - | 2.7 | Apogee S2-411 | ||
| Narrow Band PRI Incoming | 2016-08-12 | - | 3.36 | -1.93 | 2.7 | SPECT-LED |
| Narrow Band PRI Reflected | 2016-08-12 | - | 3.36 | -1.93 | 2.7 | SPECT-LED |
| Net Radiometer 4-way | 2016-08-12 | - | 3.69 | -2.43 | 2.7 | |
| Net Radiometer Bouncer | 2022-04-25 | 2022-11-02 | -248 | 60.9 | 3.34 | |
| Net Radiometer Edge | 2022-04-25 | 2022-11-02 | -425.1 | 109.8 | 3.34 | |
| PAR Sensor Incoming | 2016-08-12 | - | 3.27 | -1.8 | 275 | RAD-PAR Quantum |
| PAR Sensor Reflected | 2016-08-12 | - | 3.27 | -1.8 | 2.65 | RAD-PAR Quantum |
| PAR Sensor Under-A | 2020-04-17 | - | 0 | Under canopy PAR | ||
| Precipitation | 2016-08-12 | - | 1.33 | -1.79 | 2.7 | RAIN-TipBucGauge |
| RH & Temp | 2016-08-12 | - | 0.23 | -0.21 | 3.5 | |
| RH & Temp Bouncer Lower | 2022-04-25 | 2022-11-02 | -248.5 | 61.8 | 2.46 | Using homemade solar shield |
| 2022-11-02 | 2022-11-30 | 0.57 | 0.28 | 3.5 | Moved to main tower for intercomparison. Using homemade solar shield | |
| RH & Temp Bouncer Upper | 2022-04-25 | 2022-11-02 | -248.5 | 61.8 | 3.96 | |
| 2022-11-02 | 2022-11-30 | 0.76 | 0.51 | 3.5 | Moved to main tower for intercomparison. | |
| RH & Temp Edge Lower | 2022-04-25 | 2022-11-02 | -425.6 | 110.7 | 2.46 | Using homemade solar shield |
| 2022-11-02 | 2022-11-30 | 0.48 | 0.4 | 3.5 | Moved to main tower for intercomparison. Using homemade solar shield | |
| RH & Temp Edge Upper | 2022-04-25 | 2022-11-02 | -425.6 | 110.7 | 3.96 | |
| 2022-11-02 | 2022-11-30 | 0.43 | 0.31 | 3.5 | Moved to main tower for intercomparison. | |
| RH & Temp Lower | 2019-08-16 | 2019-09-04 | ||||
| RH & Temp Main Lower | 2022-04-25 | 2022-11-02 | -0.2 | 0 | 2.42 | |
| 2022-11-02 | 2022-11-30 | 0.91 | 0.5 | 3.5 | Moved on main tower for intercomparison. | |
| RH & Temp Main Upper | 2022-04-25 | 2022-11-02 | 0.85 | 0.5 | 3.96 | |
| 2022-11-02 | 2022-11-30 | 0.83 | 0.61 | 3.5 | Moved on main tower for intercomparison. | |
| RH & Temp Upper | 2019-08-16 | 2019-10-02 | 5.68 | |||
| Soil Moisture Probe A | 2016-08-12 | - | -2 | Horizontal SWC-TDR | ||
| Soil Moisture Probe B | 2016-08-12 | - | -2 | Horizontal SWC-TDR | ||
| Soil Moisture Probe Bouncer A | 2022-04-25 | 2022-11-02 | -247.5 | 60.1 | -0.1 | |
| Soil Moisture Probe Bouncer B | 2022-04-25 | 2022-11-02 | -247.5 | 60.1 | -0.1 | |
| Soil Moisture Probe C | 2016-08-12 | - | -2 | Horizontal SWC-TDR | ||
| Soil Moisture Probe D | 2016-08-12 | - | SWC-TDR | |||
| Soil Moisture Probe Edge A | 2022-04-25 | 2022-11-02 | -426.6 | 112.4 | -0.1 | |
| Soil Moisture Probe Edge B | 2022-04-25 | 2022-11-02 | -426.6 | 112.4 | -0.1 | |
| Soil Moisture Probe Theta | 2016-08-12 | - | -20 | Horizontal | ||
| Solar Controller | 2016-08-12 | - | SOLAR-CTRL | |||
| Solar Controller Bouncer | 2022-04-25 | 2022-11-02 | -248.5 | 61.8 | 1 | |
| Solar Controller Edge | 2022-04-25 | 2022-11-02 | -425.6 | 110.7 | 1 | |
| Solar Controller Far | 2019-08-16 | 2019-09-04 | ||||
| Solar Controller Near | 2019-08-16 | 2019-08-19 | ||||
| Solar Controller Surface Renewal | 2021-06-16 | - | Not Used | |||
| Solar Controller Upwind | 2021-07-20 | - | -267 | 92 | 1 | Advection experiment |
| Solar Panel A | 2016-08-12 | - | SOLAR-PANEL | |||
| Solar Panel B | 2016-08-12 | - | SOLAR-PANEL | |||
| Solar Panel Bouncer A | 2022-04-25 | 2022-11-02 | -233.5 | 36.3 | 2.5 | |
| Solar Panel Bouncer B | 2022-04-25 | 2022-11-02 | -233.5 | 36.3 | 2.5 | |
| Solar Panel Edge A | 2022-04-25 | 2022-11-02 | -440.6 | 136.2 | 2.5 | |
| Solar Panel Edge B | 2022-04-25 | 2022-11-02 | -440.6 | 136.2 | 2.5 | |
| Thermocouple Bouncer Profile A | 2022-04-25 | 2022-11-02 | -247.5 | 60.1 | -0.05 | |
| 2022-04-25 | 2022-11-02 | -247.5 | 60.1 | -0.1 | ||
| Thermocouple Bouncer Profile B | 2022-04-25 | 2022-11-02 | -247.5 | 60.1 | -0.05 | |
| 2022-04-25 | 2022-11-02 | -247.5 | 60.1 | -0.1 | ||
| Thermocouple Edge Profile A | 2022-04-25 | 2022-11-02 | -426.6 | 112.4 | -0.05 | |
| 2022-04-25 | 2022-11-02 | -426.6 | 112.4 | -0.1 | ||
| Thermocouple Edge Profile B | 2022-04-25 | 2022-11-02 | -426.6 | 112.4 | -0.05 | |
| 2022-04-25 | 2022-11-02 | -426.6 | 112.4 | -0.1 | ||
| Thermocouple Profile A | 2016-08-12 | - | -0.32 | |||
| 2016-08-12 | - | -0.02 | ||||
| 2016-08-12 | - | -0.04 | ||||
| 2016-08-12 | - | -0.08 | ||||
| 2016-08-12 | - | -0.16 | ||||
| Thermocouple Profile B | 2016-08-12 | - | -0.04 | |||
| 2016-08-12 | - | -0.08 | ||||
| 2016-08-12 | - | -0.02 | ||||
| 2016-08-12 | - | -0.32 | ||||
| 2016-08-12 | - | -0.16 | ||||
| Thermocouple Profile C | 2016-08-12 | - | -0.32 | |||
| 2016-08-12 | - | -0.16 | ||||
| 2016-08-12 | - | -0.08 | ||||
| 2016-08-12 | - | -0.04 | ||||
| 2016-08-12 | - | -0.02 | ||||
| Weather Station A | 2018-02-28 | 2019-06-20 | ||||
| Weather Station B | 2019-04-25 | - | First Arable CalVal | |||
| Weather Station C | 2019-05-23 | - | Second Arable CalVal | |||
| Weather Station PL_N-A | 2020-05-29 | 2021-06-16 | -53 | 46 | 1.87 | Planet Labs north pair 2 |
| Weather Station PL_N-B | 2020-05-29 | 2021-06-16 | -53.4 | 46 | 1.87 | Planet Labs north pair 2 |
| Weather Station PL_S-A | 2020-05-29 | 2021-06-16 | -35 | 21 | 1.87 | Planet Labs south pair 1 |
| Weather Station PL_S-B | 2020-05-29 | - | -35.4 | 21 | 1.87 | Planet Labs south pair 1 |
Data Streams:
more data
| Code | First Day | Last Day | Description |
|---|---|---|---|
| BA_adexcr1k | 2022-04-25 | 2022-11-02 | 30-minute averages of data from CR1000 on the main BA tower measuring the upper and lower sonics |
| BA_adextrh | 2022-04-25 | 2022-11-02 | 30-minute averages of temperature and RH data from the main BA met CR1000 |
| BA_arable | 2018-02-28 | - | Hourly met data from an Arable Mark device. Raw times are in UTC, hourly averages with the time at the beginning of the averaging period beginning 20190401 changed to 30min data PST at end of averaging period. - stored in PST at end of averaging period. |
| BA_bncr23x | 2022-04-25 | 2022-11-02 | 30-min averages of met data from BA Bouncer CR23X |
| BA_bncrcr6 | 2022-04-25 | 2022-11-02 | Lower sonic at BA Bouncer tower |
| BA_bncrli75 | 2022-04-25 | 2022-11-02 | Upper sonic and CO2/H2O data from BA Bouncer tower |
| BA_bncrtrh | 2022-04-25 | 2022-11-02 | 30min averages from 10sec lower and upper T/RH readings at BA Bouncer tower |
| BA_cam | 2016-11-04 | - | Digital number data from Pheoncamera at Bouldin Alfalfa Phenocam archive |
| BA_edge23x | 2022-04-25 | 2022-11-02 | 30-min averages of met data from BA Edge CR23X |
| BA_edgecr6 | 2022-04-25 | 2022-11-02 | Lower sonic at BA Edge tower |
| BA_edgeli75 | 2022-04-25 | 2022-11-02 | Upper sonic and CO2/H2O data from BA Edge tower |
| BA_edgetrh | 2022-04-25 | 2022-11-02 | 30min averages from 10sec lower and upper T/RH readings at BA Edge tower |
| BA_fd | 2018-07-12 | - | Soil respiration data at BA from the second generation Forced Diffusion chamber from Eosense. The raw data is collected at 5min intervals and averaged to 30min values. The chamber is located under the tower. Alfalfa was removed from inside the chamber. |
| BA_fdb | 2020-04-17 | 2020-09-23 | Soil CO2 flux from an Eosense Forced Diffusion Chamber, 2nd chamber added under BA tower |
| BA_flux | 2016-08-12 | - | 30min averages of high frequency flux data from Licor GHG files |
| BA_irtsr | 2021-06-16 | 2024-01-04 | Surface temperature from two Apogee IRT sensors one pointing north and the other south at a 45 deg inclination. These are recorded at both 2Hz and 30min averages for surface renewal by Kevin Tu. |
| BA_met | 2016-08-12 | - | Micromet data from the Bouldin Alfalfa site recorded by a CR1000 as 30min averages of 10sec samples. |
| BA_processed | 2016-08-13 | - | Fluxes and derived values from Level 1 processing |
| BA_processed3 | 2016-08-13 | - | Gap filling and partitioned data from Level 3 processing |
| BA_sentek | 2021-08-25 | - | Soil data from the 1m long Sentek probe connected to the Arable. Original data is hourly average with UTC timestamp at the beginning of the averaging period. The times have been adjusted back 7.5 hours to the middle of the averaging period in local standard time and linearly interpolated to 30min intervals. |
Metadata and Data Sets:
more data
| Id | Type | Site | Dates | Frequency | Title | Description |
|---|---|---|---|---|---|---|
| 5 | Dist & Mgmt | BA | 2016-08-15 - Present | Various as needed | Farm operations and observed phnomena | Dates and information on farm operations, grazing and observed phenomena gleaned from field visits, camera images and conversations. |
| 14 | Harvest | BC, BA | 2016-01-01 - 2019-01-01 | Annual harvest estimates | Bouldin Island annual farmer yield estimates, 2016, 2017, 2018 | Corn silage and alfalfa yield estimates from farmers on Bouldin Island, 2016, 2017, 2018 |
| 16 | LAI | BC, BA, TA | 2017-07-26 - 2020-07-30 | Approx. monthly during growing season with field visits | Optical LAI measured in-situ | ~10 measurements taken each time with a LAI-2200C. Most of the measurements were taken with the 2-wand method, where an "above" wand was set up on a tripod and took measurements every 5 sec, and a "below" wand was used to collect data below the crop canopy. The data were processed in the Licor software FV2200, where each "below" measurement was paired with the "above" measurement closest in time; LAI was calculated and corrected for scattering (based on 4A scattering data). Twitchell Alfalfa: 2017 (2), 2018 (2) Bouldin Alfalfa: 2017 (3), 2018 (9) Bouldin Corn: 2017 (5), 2018 (7) |
| 26 | Lidar | BA, BC, EE, MB, SB, SW, TA, WP | 2016-12-01 - 2017-03-07 | Once | Delta-wide USGS Lidar flight | Winter time Lidar flight commissioned by the USGS and flown by Woolpert. Horizontal datum: NAD83 (NSRS2007) Epoch 2017.95, UTM Zone 10N, meters. Vertical datum: NAVD88, GEOID12B, US Survey Feet, Orthometric. Includes classified point cloud, features shape files, bare earth DEM, orthometric imagery (0.3-meter16-bit 4-band RGB-IR tiles in TIFF format with World Files). The entire Delta is covered by 8 points per m2, 0.5m DEM. |
| 3 | Lidar | BA, BC, WP, EP, EE, TA, TW, MB, SB, SW | 2018-09-20 | Once | NCALM Lidar Flight | Lidar flight data collection from Kyle Hemes NCAL project: Ecosystem Structure as a Driver of Climatic, Habitat, and Hydrological Services in Heterogeneous Restored Wetlands. Point clouds (*.las files), 1m resolution DEM and DSM (arcgis GridFloat files), visible imagery (*.tif files) of Sherman, Twitchel and Bouldin Islands. UTM Zone 10N, meters, NAD83(2011) epoch 2010.00 / NAVD88 (GEOID12B) |
| 25 | Soils | SB, BC, EP, EE, BA, SW, MB | 2018-08-27 - 2018-08-28 | Once | Soil cores for C:N and microbial community | Soil samples were collected to be analyzed for soil moisture, bulk density, C:N, and microbial community. Generally at each site, two transects were sampled (T1 to the north, T2 south), starting near the tower and going to the west. Each transect had 5 sampling locations each (P1-P5), each location about 5m apart. At wetland locations (SW, MB, EE, EP, WP), soils were collected at 0-15cm depth. At agricultural locations (BA, BC, SB), soils were collected at 3 depths: 0-15cm, 15-30cm, and 30-60cm. For more information, see the field notes from each day. 2018-08-27 -Sherman Barn: The water table was around 50-60cm. -Bouldin Corn: Transects starting from the first corn rows running parallel away from the tower. Dry peat layer around 60 cm. -Bouldin Alfalfa: Transects starting roughly 5m from the tower. A smaller subsample was taken for microbial analysis. -East End: Transects starting 5-10m from the tower, going west/southwest through dense veg with the T2P4 and T2P5 taken from veg near the open water section. A smaller subsample was taken for microbial analysis. -East Pond: Transects starting about 7m from tower to the west (T1) and southwest (T2). (i.e. after the big open pond section by the solar panels). A smaller subsample was taken for microbial analysis. T2P5 was taken from the more uniformly vegetated area to the west. Other samples were mostly from fairly open water areas near clusters of veg. 2018-08-28 -Mayberry: Two transects (T1 in veg, T2 near the open water) each going northwest of the tower and took microbial subsamples from each core. -Sherman Wetland: We took two transects (T1 to the north, T2 south) going west from the tower starting where the water was about 20 cm deep and following the low vegetation. |
| 8 | Spectra | BA | 2017-08-23 - Present | Approx. monthly during summer with field visits | Handheld Spectral Reflectance | Spectral typically collected with and Ocean Optics JAZ spectrometer (sn JAZA2903) 400nm-900nm useful spectrum. An incoming reference, dark and reflected sample spectra are collected to generate reflectance spectra. A cosine corrected diffuse head is held by hand at about shoulder height facing up or down. |
https://youtu.be/4O-pm9zjTkQ - Timelapse of Bouldin Alfalfa field including raking and baling from seven days of 1min images.
BouldinFieldMap.jpg - Map of fields and camps on Bouldin Island
Delta SW PAR Comparison 10-2016
GCC comparision - Midday vs. Whole-day
BA NDVI Comparison 2017
Forced Diffusion Bouldin Alfalfa
Manual vs Turbulent Vegetation Height
Bouldin Alfalfa - NDVI (SRS, Apogee, Arable, Planet)
HMP intercomparison - BA 11/2021