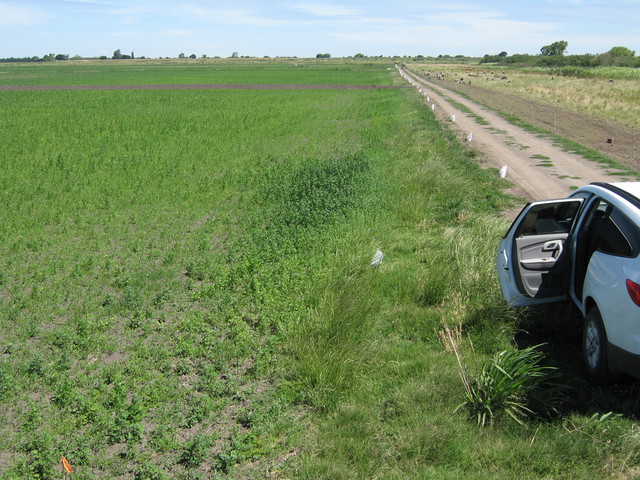
Site: Twitchell Rice (TW) aka US-Twt
2007-01-01 - 2017-04-04
The Twitchell Island site is a rice paddy that is owned by the state and managed by the California Department of Water Resources. While Bare Peat field was leveled for rice planting, the tower was installed on April 3, 2009. The rice paddy was converted from corn in 2007. In Summer 2009, Bispyribac-sodium and Pendimethalin herbicides were applied to the fields prior to rice planting and flooding, then pesticide and fertilizer application took place. Each year after rice is planted in the spring by drilling, the field is flooded. Then, the field is drained in early fall, rice is harvested, and the field site is moved.
Last field site visit: more fieldnotes
| 2017-04-04 10:20:00 | Removed Twitchell Rice tower |
Latest data processing: more processing notes
| 2023-03-10 | Cleaning TA, RH, PA for ONEFlux processing for dates: 2009-04-03 - 2017-04-04 |
| Processor of record: 2014-05-29 - Sara Knox 2023-03-10 - Daphne Szutu |
Ameriflux Author:
20090403 - Sara Knox 20090403 - Jaclyn Hatala Matthes 20090403 - Joseph Verfaillie 20090403 - Dennis Baldocchi |
Data Digital Object Identifier (DOI)
AmeriFlux: https://doi.org/10.17190/AMF/1246140
FLUXNET2015: https://doi.org/10.18140/FLX/1440106
FLUXNET-CH4: https://doi.org/10.18140/FLX/1669700
Equipment Locations
more details
| Equipment | Start Date | End Date | X | Y | Z | Notes |
|---|---|---|---|---|---|---|
| Anemometer | 2014-10-16 | - | 0 | 0 | 3.05 | |
| 2014-10-16 | - | -0.206116 | 0.0319994 | 2.91879 | Sonic | |
| Barometer | 2014-10-16 | - | 0.356716 | 0.2 | 0.56 | |
| Data Logger Eddy | 2009-04-03 | 2012-05-07 | CR1000 | |||
| Data Logger Met | 2014-10-16 | - | 0.356716 | 0.1 | 0.86 | 23x |
| DO Sensor | 2014-10-16 | - | 0 | 1 | 0.01 | DO |
| Gas Analyzer CH4 | 2014-10-16 | - | 0 | 0 | 2.85149 | LI-7700 |
| Gas Analyzer CO2/H2O | 2014-10-16 | - | -0.0116874 | 0.0662824 | 2.91879 | LI-7500A |
| Heat Flux Plate A | 2014-10-16 | - | -1.7 | -2.94449 | -0.02 | SHF |
| Heat Flux Plate B | 2014-10-16 | - | ||||
| Heat Flux Plate C | 2014-10-16 | - | ||||
| Heat Flux Plate D | 2009-04-03 | - | ||||
| Interface LI-7500 | 2014-10-16 | - | -0.308925 | 0.178358 | 0.765033 | AIU |
| LED sensor LED Sensor | 2014-10-16 | - | -2.82129 | 0.971447 | 1.81948 | LED |
| Multiplexer Thermocouple | 2014-10-16 | - | 0.356716 | -0.2 | 0.765033 | 25t |
| Net Radiometer | 2014-10-16 | - | -3.23281 | 1.11315 | 1.81948 | Rnet |
| PAR Sensor Incoming | 2014-10-16 | - | -2.96435 | 0.996981 | 1.81948 | PAR_in |
| PAR Sensor Reflected | 2014-10-16 | - | -2.96435 | 0.996981 | 1.71948 | PAR_out |
| Precipitation | 2014-10-16 | - | 4.11 | 0 | 0.01 | Rain |
| Pyranometer | 2014-10-16 | - | 0.918509 | -0.316268 | 2.4342 | Pyra |
| RH & Temp | 2014-10-16 | - | 0.727595 | -0.250531 | 2.29061 | HMP45 |
| Soil Moisture Probe A | 2014-10-16 | - | -1.95016 | -2.78512 | -0.15 | SM1 |
| Soil Moisture Probe B | 2014-10-16 | - | -0.866025 | 0.5 | -0.15 | SM2 |
| Thermocouple Profile | 2014-10-16 | - | -1.80265 | -3.12228 | 0 | TC1 |
| 2014-10-16 | - | -3.6053 | 0 | 0 | TC2 | |
| 2014-10-16 | - | -1.80265 | 3.12228 | 0 | TC3 | |
| Water Level | 2014-10-16 | - | 0 | 1 | 0.01 | well |
Data Streams:
more data
| Code | First Day | Last Day | Description |
|---|---|---|---|
| TW_cam | 2009-05-13 | 2017-04-03 | Digital number data from the autocam imagery Phenocam archive |
| TW_cimis | 2007-01-01 | 2009-12-31 | Data from the CIMIS Twitchell Island station #140 http://wwwcimis.water.ca.gov/WSNReportCriteria.aspx. The original hourly data has been linearly interpolated to 30min intervals. |
| TW_flux | 2009-06-17 | 2017-04-04 | 30 minute averages of the high speed data channels recorded by the CR1000. TOA5_23865.TW_Slow_%Y_%j_%H%M.dat %Y-%m-%d %H:%M:%S,0,1 |
| TW_met | 2009-04-03 | 2017-04-04 | Met data from the CR23x on the tower. |
| TW_processed | 2009-04-03 | 2017-04-04 | Fluxes and derived values from Level 1 processing |
| TW_processed3 | 2009-04-03 | 2017-04-04 | Gap filling and partitioned data from Level 3 processing |
Metadata and Data Sets:
more data
| Id | Type | Site | Dates | Frequency | Title | Description |
|---|---|---|---|---|---|---|
| 3 | Lidar | BA, BC, WP, EP, EE, TA, TW, MB, SB, SW | 2018-09-20 | Once | NCALM Lidar Flight | Lidar flight data collection from Kyle Hemes NCAL project: Ecosystem Structure as a Driver of Climatic, Habitat, and Hydrological Services in Heterogeneous Restored Wetlands. Point clouds (*.las files), 1m resolution DEM and DSM (arcgis GridFloat files), visible imagery (*.tif files) of Sherman, Twitchel and Bouldin Islands. UTM Zone 10N, meters, NAD83(2011) epoch 2010.00 / NAVD88 (GEOID12B) |
Cospectra_Comparison_Delta.pdf - Plots of cospectra from the Delta sights
UCB_LI7700Testing.pdf - Report on the testing of the LI-7700 in the Delta
7500SoftwareUpdate.pdf - Software update instructions
Collecting_LI-7700_Ethernet_Data.pdf -
LI-820_840_Embedded_CGA103.pdf -
RiceProjectInfo.pdf -
https://youtu.be/bBYWfDRyLWU - Flooding on Twitchell rice field 2011-06-14 to 16
https://youtu.be/jQJirdSvsZs - Flash flood up and draining 2011-05-11 to 20
4-way Radiometer Comparison 10-2016
Delta SW PAR Comparison 10-2016


