Field Notes
<--2008-01-30 00:00:00 |
2008-02-21 00:00:00-->
Other sites visited today:
Tonzi |
Vaira
Phenocam link:
Searching...Tonzi: 2008-01-30 10:00:00 (DOY 30)
Author: Siyan Ma
Others:
When: Date: 1/30/2008
, Day: 30 , Watch Time: 10:00
.
Where:
Tonzi/Vaira Ranch
Who:
Siyan
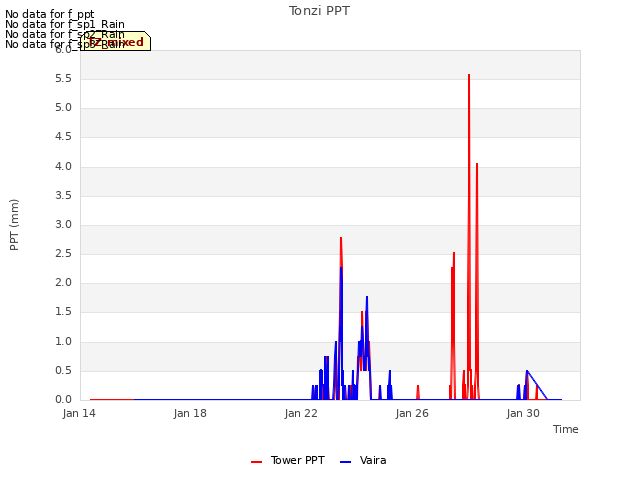
Weather: partially cloudy, about 50% cloud coverage
Phenology:
wetter. Grass grew bigger and more new grass
germinated. Water in Mr. Tonzi’s pond
was half-filled and looked muddy. A lot
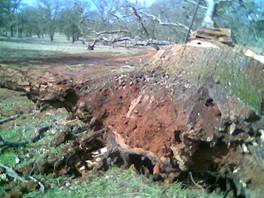
of cow footprints at Tonzi. Mr. Tonzi
was cutting a big falling tree. He said,
“It’s too tired to stand up.” The big
falling tree is the one closed to floor site. Basal diameter is 42.36 inches. It is a red oak because it has thin sap layer
and pink woody center. See more pictures at D:\Field_Notes\Year2008\photo_Day30_30Jan2008
Summary
- EC systems were working well
at the three sites.
- CO2 and N2 tank is in low pressure, about 100 psig!!!
- grass leaf collected for
LAI. Stems also counted.
- Met Ted at the gate of
Vaira. He just checked Vaira site
and found out the solar panel of the gate didn’t work. He’s going to fix it soon.
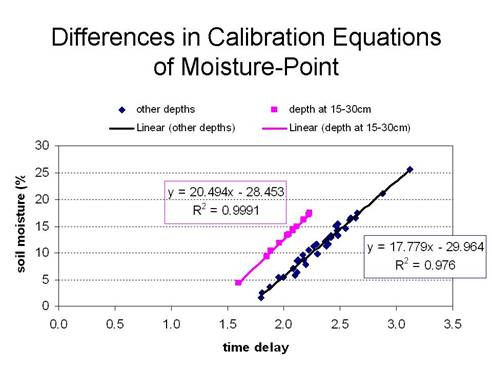
- see differences in calibration equations of soil moisture machine
– Moisture-Point! (Matteo noticed the problem in Sherman
Island, and we saw the similar
thing at Tonzi.)
Vaira_Grass Site
- Fence and gate power: BROKEN v.
- Panel and Batteries: 12.7 v; 6.3 amps; 3.2
amps.
- Reading from Gillsonic screen
before downloading data. (The value
of H2O and CO2 should be in the range of 0 – 5 v.)
Time
|
|
Path/File
name
|
D:\Data\V08_030 .flx
D:\Data\VR08 .raw
|
|
mean
|
std
|
|
mean
|
std
|
w
|
0.8
|
|
Ts
|
15.3
|
1.534
|
u
|
-0.23
|
|
H2O
|
1.715
|
0.072
|
v
|
0.05
|
|
CO2
|
1.98
|
0.039
|
|
|
|
Tc
|
1.12
|
0.185
|
- downloading data – Yes. However, instant readings from Data
logger at Vaira were all zero!!!
Met data weren’t downloaded to the PC after Day 10.
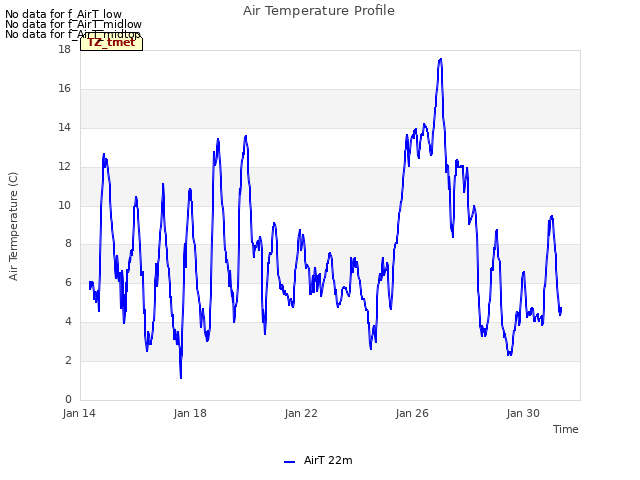
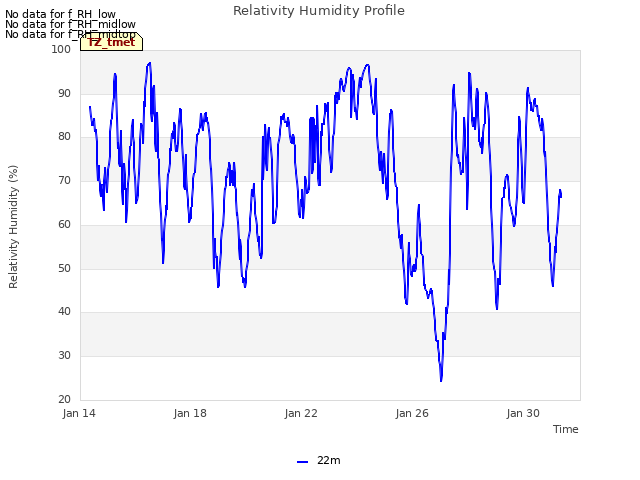
- check the fans of air temp.
and relative humidity sensors at Vaira. OK.
- Check MD-9 system connections.
OK.
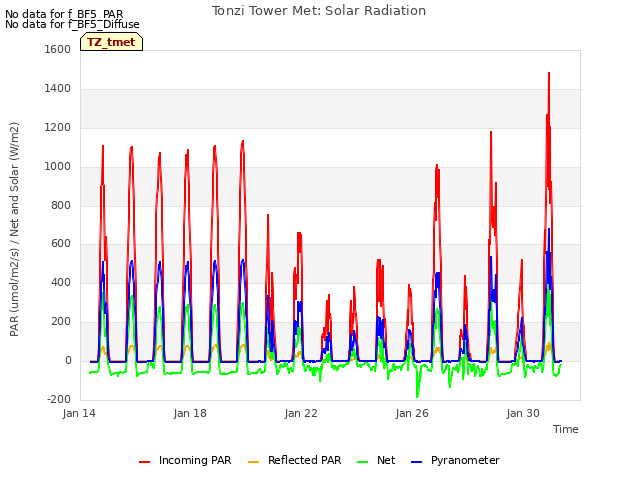
- Check levels of Radiation
sensors, clear up surfaces. Yes.
- Closed gate and set up fence.
- Voltage meter of Vaira fence looks broken because the pointer was always
on the far right side even though the switch was off.
Tonzi_Tower Site
- Fence and gate power: >12 v.
- Panel and Batteries: 12.0 v; 0.0 amps; 4.6
amps.
- Reading from Gillsonic screen
before downloading data. (The value
of H2O and CO2 should be in the range of 0 – 5 v.)
Time
|
|
Path/File
name
|
D:\Data\T08_030 .flx
D:\Data\TW08 .raw
|
|
mean
|
std
|
|
mean
|
std
|
w
|
-0.48
|
0.416
|
Ts
|
9.6
|
0.546
|
u
|
-0.51
|
0.554
|
H2O
|
1.5
|
0.030
|
v
|
3.6
|
1.005
|
CO2
|
2.2
|
0.014
|
- downloading data Yes.
- check the fans of air temp.
and relative humidity sensors on the tower and the floor. Yes.
- Check calibration cylinders;
CO2 100
psig; flow 20 psi.
(Tank: 422.2 ppm)
N2 100
psig; flow 20 psi.
Manually
calibrate Li-800. Following Ted’s
instruction: H:\IoneSavanna_2004\Tower_2004\CO2Profile\LI800_Calibration_Procedure_2Nov04.txt
Is the pump running Yes.
Readings:
388
|
384
|
387
|
387
|
0.035
|
422
|
940
|
940
|
940
|
940
|
940
|
940
|
43
|
43
|
43
|
44
|
43
|
43
|
49
|
49
|
49
|
49
|
48
|
48
|
How to check the CO2 values Click “Ports/Flags” button to see which ports
or flags is setting high. Pressure
should be less than ambient value. When
Flag 8 is high, it may indicate that RRR’s battery is low.
- close gate and set up fence.
Yes.
Toniz_Floor Site
- Fence and gate power: >12 v.
2. Panel and Batteries: 12.8 v;
4.6 amps; 2.0
amps.
3. Reading from Gillsonic screen before downloading
data. (The value of H 2O and
CO 2 should be in the range of 0 – 5 v.)
Time
|
|
Path/File
name
|
D:\Data\F08_030 .flx
D:\Data\FL08 .raw
|
|
mean
|
std
|
|
mean
|
std
|
w
|
-0.02
|
0.21
|
Ts
|
10.2
|
0.39
|
u
|
-1.2
|
0.401
|
H2O
|
1.823
|
0.109
|
v
|
-0.27
|
0.725
|
CO2
|
2.166
|
0.009
|
- downloading data Yes.
- Close gate and set up fence.
Yes.
Soil Moisture measurement:
tonzi
|
7931AFE
|
402165
|
574B4B
|
402FF3
|
574632
|
7A432E
|
7A3C6E
|
7A3B40
|
7A4AAA
|
30-Jan-08
|
30
|
|
|
|
|
|
|
|
|
|
SM
|
|
|
|
|
|
|
|
|
0-15
|
44.6
|
32.7
|
44.0
|
40.5
|
39.0
|
42.0
|
28.8
|
25.3
|
22.0
|
15-30
|
40.5
|
41.7
|
39.3
|
39.6
|
40.5
|
39.9
|
31.0
|
35.3
|
25.8
|
30-45
|
41.3
|
44.1
|
41.3
|
39.9
|
45.8
|
36.8
|
34.3
|
34.6
|
36.8
|
45-60
|
40.3
|
54.3
|
60.3
|
49.1
|
41.4
|
35.4
|
44.8
|
45.7
|
40.0
|
|
|
|
|
|
|
|
|
|
|
|
A6D882B
|
A3D04E8
|
A6D72F5
|
|
|
|
|
|
|
|
|
|
|
|
|
|
|
|
|
0-15
|
37.0
|
34.1
|
29.4
|
|
|
|
|
|
|
15-30
|
30.4
|
37.8
|
37.4
|
|
|
|
|
|
|
30-45
|
37.4
|
36.6
|
37.7
|
|
|
|
|
|
|
45-60
|
42.8
|
48.3
|
45.6
|
|
|
|
|
|
|
|
|
|
|
|
|
|
|
|
|
vaira
|
57318a
|
7933dee
|
|
|
|
|
|
|
|
0-15
|
26.4
|
25.0
|
|
|
|
|
|
|
|
15-30
|
28.6
|
34.1
|
|
|
|
|
|
|
|
30-45
|
32.1
|
32.9
|
|
|
|
|
|
|
|
45-60
|
35.4
|
38.0
|
|
|
|
|
|
|
|
|
|
|
|
|
|
|
|
|
|
Atten: Only useful after "Tonzi" is
sorted by Ordering & Depth after data input.
|
|
|
|
|
|
|
|
|
|
|
|
|
|
|
|
|
|
|
|
|
|
|
Tonzi
|
|
|
|
Dendrometer
|
|
|
|
|
|
|
Date
|
Day
|
Tag #
|
Reading (cm)
|
1/30/2008
|
30
|
71
|
X
|
|
|
72
|
7.3
|
|
|
77
|
X
|
|
|
78
|
X
|
|
|
79
|
12.3
|
|
|
245
|
4.5
|
|
|
248
|
14.5
|
|
|
250
|
10.5
|
|
|
255
|
X
|
|
|
252
|
X
|
|
|
102
|
5.1
|
|
Field Data
No tank data
No TZ Well data found
No TZ Moisture Point data found
No VR Moisture Point data found
No TZ grass heigth found
No VR grass heigth found
No TZ Tree DBH found
No water potential data found
No TZ Grass Biomass data found
No TZ OakLeaves Biomass data found
No TZ PineNeedles Biomass data found
0 photos found
16 sets found
No data found for TZ_Fenergy.
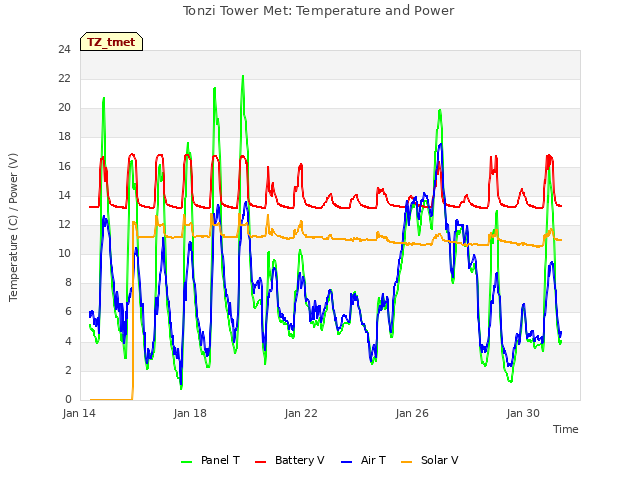
11 TZ_tmet graphs found


No data found for TZ_soilco2.
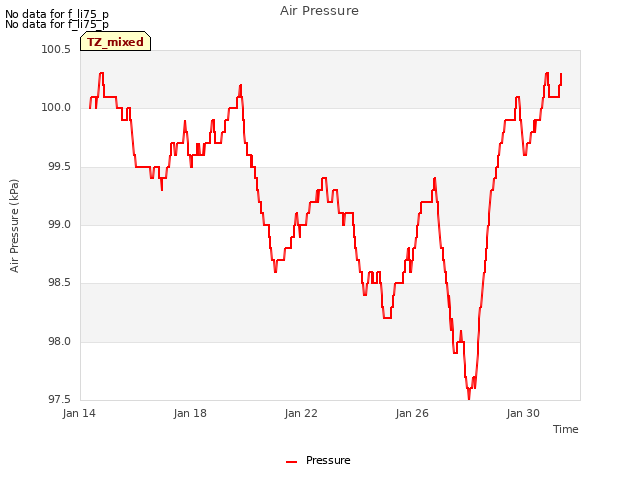
Can't check TZ_mixed
3 TZ_mixed graphs found

No data found for TZ_fflux.
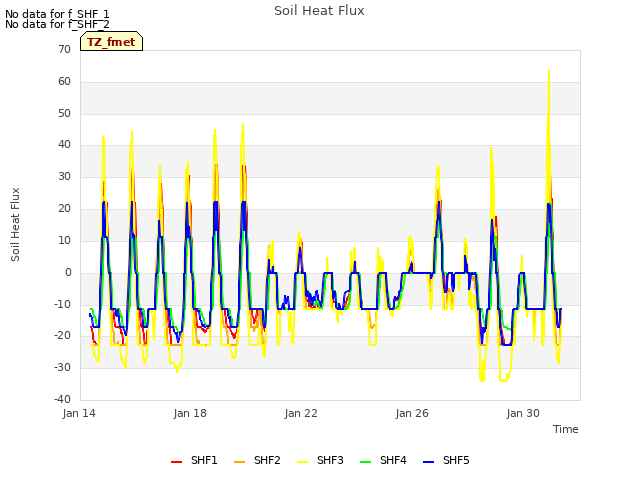
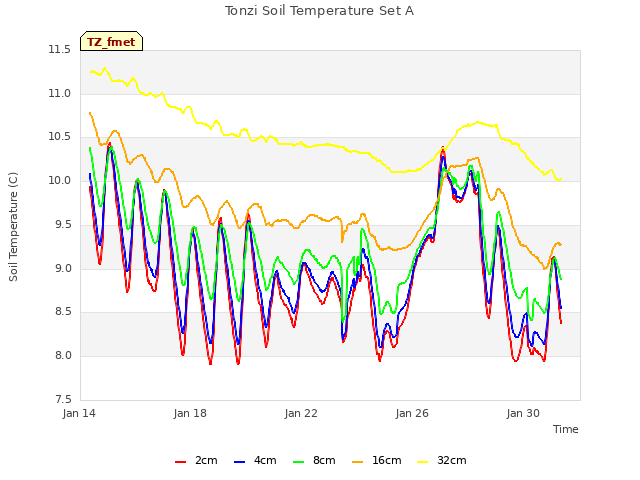
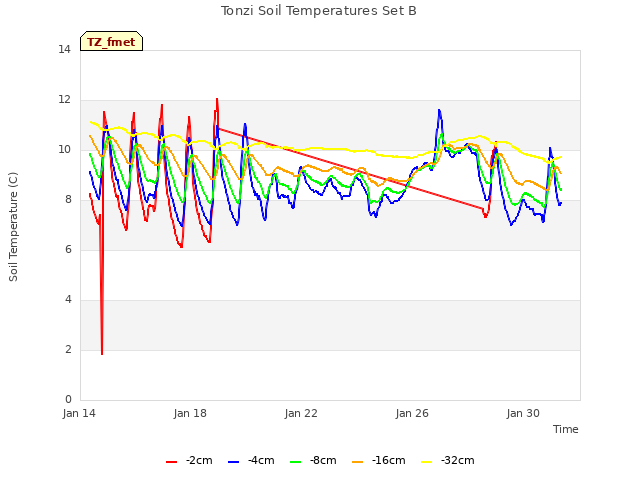
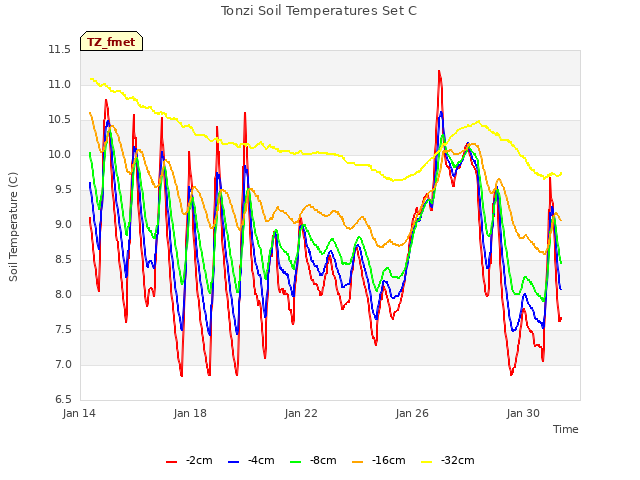
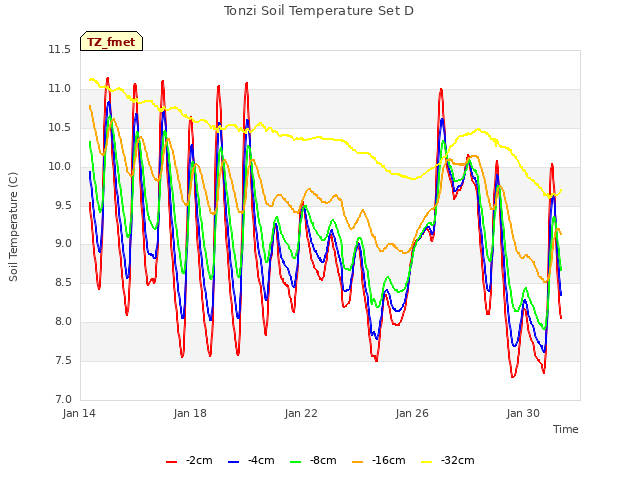
8 TZ_fmet graphs found


No data found for TZ_tram.
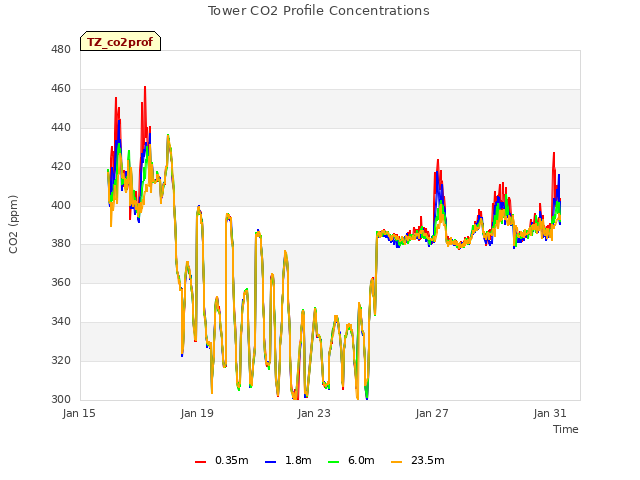
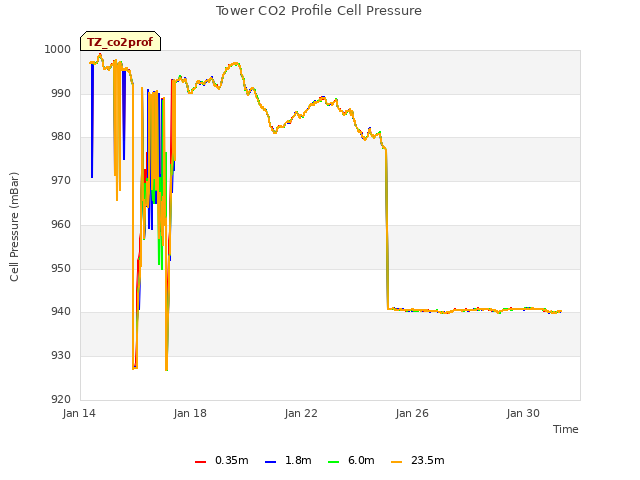
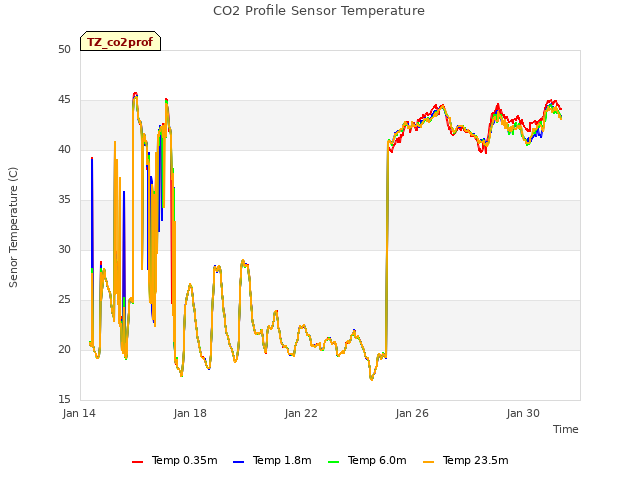
3 TZ_co2prof graphs found
No data found for TZ_irt.
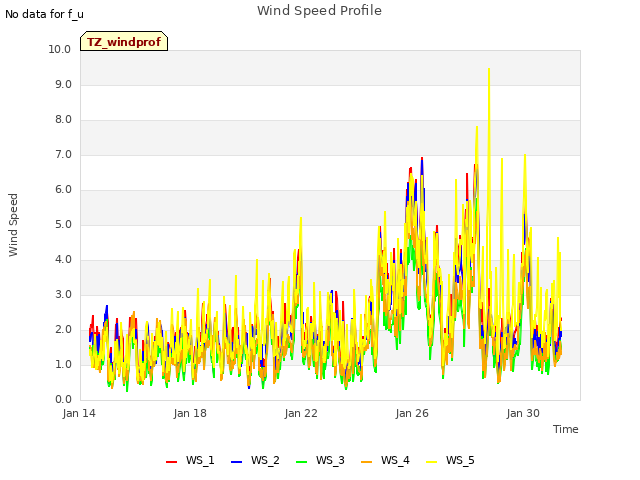
1 TZ_windprof graphs found
No data found for TZ_tflux.
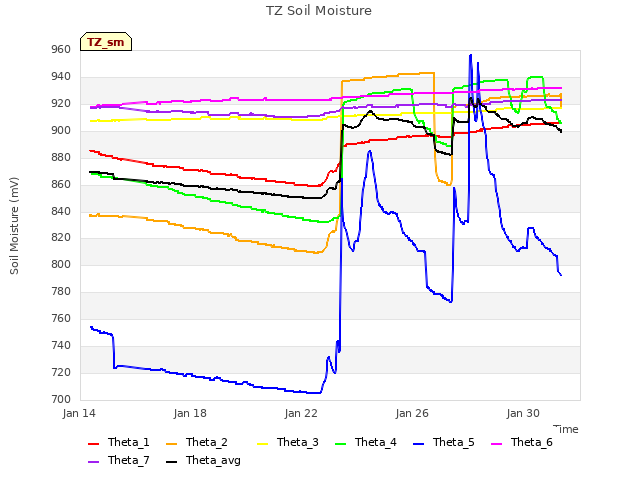
2 TZ_sm graphs found

Can't check TZ_met
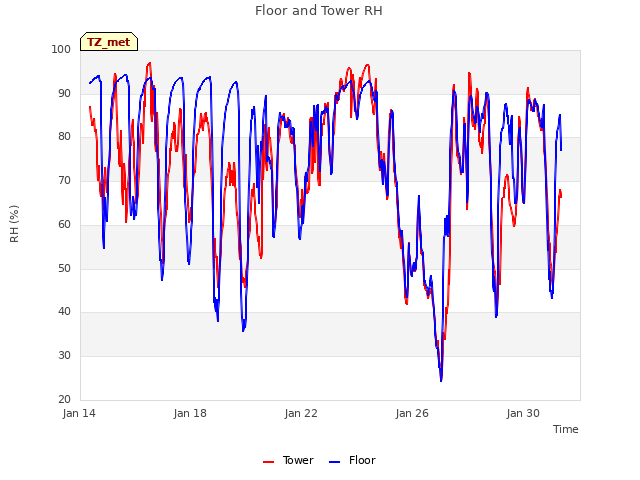
1 TZ_met graphs found
Can't check TZVR_mixed
No data found for TZ_osu.
No data found for TZ_fd.
Tonzi Z-cam data