Field Notes
<--2009-03-12 10:00:00 |
2009-04-03 05:30:00-->
Phenocam link:
Searching...Tonzi: 2009-03-27 10:00:00 (DOY 86)
Author: Siyan Ma
Others: Gretchen
When: Date: 3/27/2009 , Day: 86
, Watch Time: 10:00am .
Where: Tonzi/Vaira Ranch
Who: Siyan, Gretchen
Weather:
clear, nice warm
Phenology:
oak leaf out, vaira grass white flowers, Tonzi grass yellow flowers
Summary
- WebCam wasn’t working. Talked to Joe on the phone. Replugged the power connections of
tz6-23X datalogger. Problems were
fixed.
- Flux systems were working
well at Tower, Floor, and Vaira, and data were downloaded.
- Vaira 10Hz thermocouple looked very spiky.
- Calibrated Li-800 in the
field (bring the copy of Ted’s instruction).
- Collected grass sample for
LAI
- read dendrometer
- took soil moisture
measurements
- spectrometer (Youngryle)
- filed pictures
Vaira_Grass
Site
- Fence and gate power: 12
v.
- Panel and Batteries: 12.1 v; 5.9 amps; 2.3 amps.
- Reading from Gillsonic screen
before downloading data. (The value
of H2O and CO2 should be in the range of 0 – 5 v.)
Time
|
|
Path/File name
|
D:\Data\V09_ 86 .flx
D:\Data\VR09 .raw
|
|
mean
|
std
|
|
mean
|
std
|
w
|
0.40
|
0.404
|
Ts
|
23.6
|
0.953
|
u
|
2.31
|
1.301
|
H2O
|
2.5
|
0.298
|
v
|
3.36
|
0.857
|
CO2
|
1.7
|
0.076
|
|
|
|
Tc
|
2.1
|
0.169
|
- Vaira 10Hz thermocouple looked very spiky.
- downloading data YES!
- Check the fans of air temp.
and relative humidity sensors at Vaira. YES!
- Check MD-9 system connections
YES!
- Check CR23X with two
multiplexers
Sys_vot = 13.26
PC_start =
- Check levels of Radiation
sensors, clear up surfaces. YES!
- Check rain gage, make sure
not clogged. YES!
- Closed gate and set up fence.
YES!
Tonzi_Tower Site
- Fence and gate power: 12
v.
- Panel and Batteries: 13.2 v; 0.0 amps; 5.4 amps.
- Reading from Gillsonic screen
before downloading data. (The value
of H2O and CO2 should be in the range of 0 – 5 v.)
Time
|
|
Path/File name
|
D:\Data\T09_ 86 .flx
D:\Data\TW09 .raw
|
|
mean
|
std
|
|
mean
|
std
|
w
|
-0.14
|
0.2
|
Ts
|
19.3
|
0.36
|
u
|
-0.93
|
0.65
|
H2O
|
1.63
|
0.05
|
v
|
1.23
|
0.24
|
CO2
|
2.01
|
0.02
|
- downloading data YES!
- check the fans of air temp.
and relative humidity sensors on the tower and the floor. YES!
- Check rain gage, make sure
not clogged. YES!
- Check calibration cylinders;
CO 2 1750 psig; flow 20
psi.
N 2 1250
psig; flow 20 psi.
Manually calibrate Li-800. YES! Following Ted’s instruction: H:\IoneSavanna_2004\Tower_2004\CO2Profile\LI800_Calibration_Procedure_2Nov04.txt
Is the pump running YES! (an extra pump were put in the
analyzer enclosure.)
How to check the CO2 values
Click “Ports/Flags” button to see which ports or flags is setting
high. Pressure should be less than
ambient value. When Flag 8 is high, it
may indicate that RRR’s battery is low.
1
|
2
|
3
|
4
|
zero
|
span
|
393
|
392
|
393
|
394
|
1.54
|
433.62
|
947
|
945
|
942
|
942
|
947
|
947
|
45
|
45
|
45
|
45
|
43
|
43
|
51
|
51
|
51
|
51
|
50
|
50
|
- close gate and set up fence. YES!
Toniz_Floor
Site
- Fence and gate power: 12
v.
- Panel and Batteries: 13.6 v; 14.5 amps; 3.2 amps.
- Reading from Gillsonic screen
before downloading data. (The value
of H2O and CO2 should be in the range of 0 – 5 v.)
Time
|
|
Path/File name
|
D:\Data\F09_
86 .flx
D:\Data\FL09 .raw
|
|
mean
|
std
|
|
mean
|
std
|
w
|
-0.05
|
0.227
|
Ts
|
18.1
|
0.330
|
u
|
0.05
|
0.722
|
H2O
|
2.8
|
0.044
|
v
|
1.23
|
0.520
|
CO2
|
1.7
|
0.014
|
- downloading data YES!
- Check MD-9 system connections
YES!
CR23X3 – floor-Met
CR23X5 – soil CO 2
profile
CR23X6 – tower-Met
CR10X2 – floor-Met
CR10X4 – sap-flow
CR10X7 – CO 2 profile
CR10X8 – wind profile
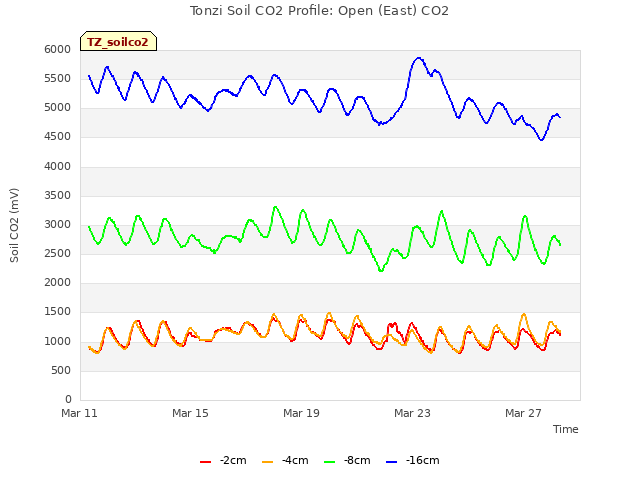
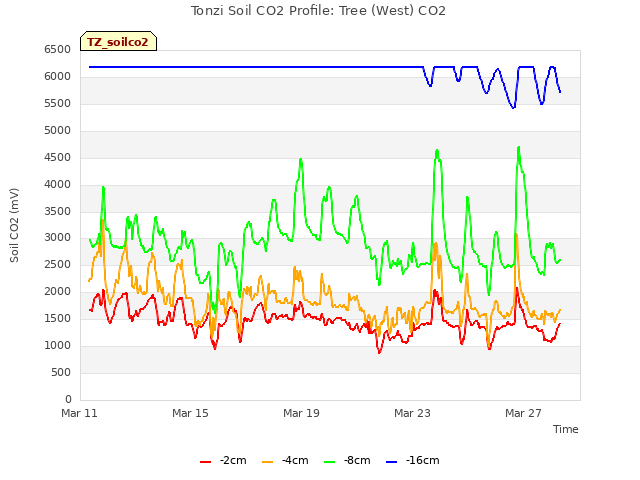
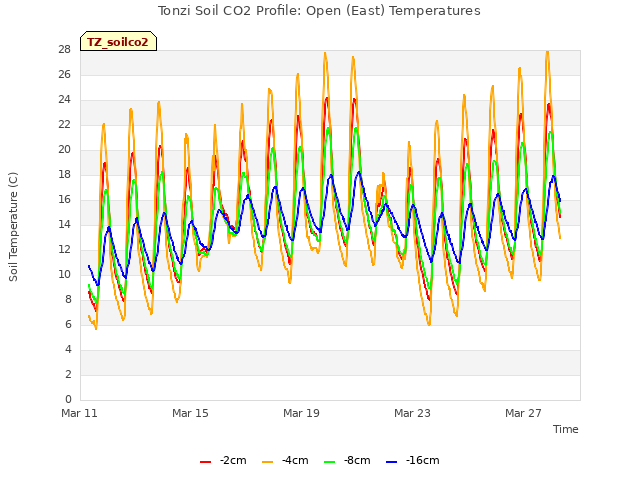
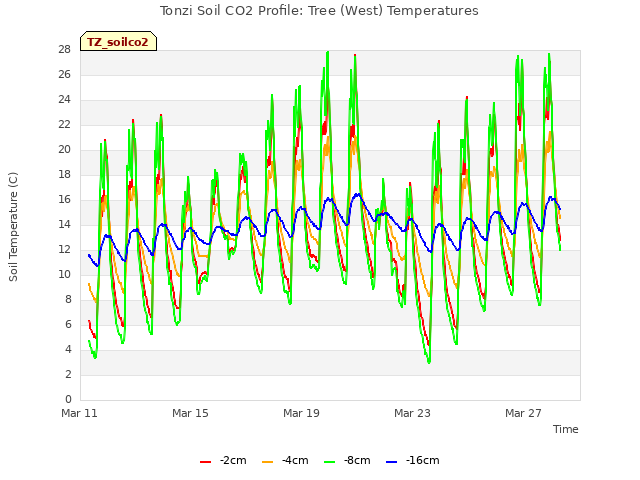
- Soil CO2 profile
Reading
from datalogger
Panel
temp
|
26
|
|
|
Battery
voltage
|
13
|
|
|
CO2E_1
|
891
|
TCE_1
|
19
|
CO2W_1
|
1149
|
TCW_1
|
22
|
CO2E_2
|
1054
|
TCE_2
|
23
|
CO2W_2
|
1652
|
TCW_2
|
18
|
CO2E_3
|
2361
|
TCE_3
|
16
|
CO2W_3
|
2672
|
TCW_3
|
25
|
CO2E_4
|
2275
|
TCE_4
|
13
|
CO2W_4
|
2896
|
TCW_4
|
14
|
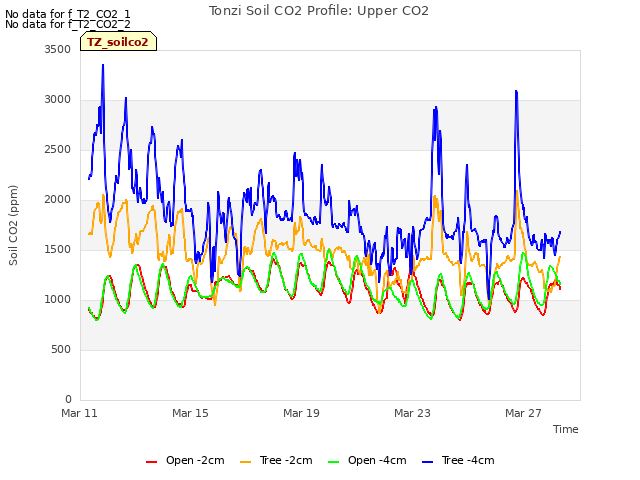
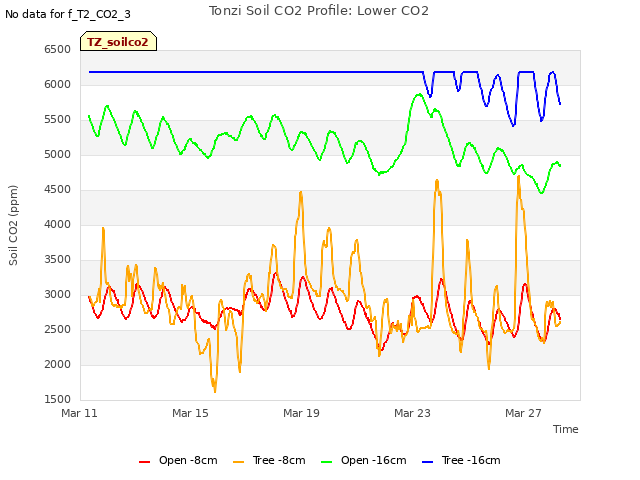
Reading
from panels of analyzers
depth
|
Open
|
order
|
depth
|
Tree
|
order
|
2cm
(1%)
|
1830
|
1
|
2cm
(1%)
|
2330
|
1
|
4cm
|
2180
|
2
|
4cm
|
3370
|
4
|
8cm
|
4750
|
3
|
8cm
|
5630
|
2
|
16cm
|
9320
|
4
|
16cm
|
1.18%
|
3
|
- Close gate and set up fence. YES!
Tonzi
|
|
|
|
Dendrometer
|
|
|
|
|
|
|
Date
|
Day
|
Tag #
|
Reading (mm)
|
3/27/2009
|
86
|
71
|
X
|
|
|
72
|
x
|
|
|
77
|
X
|
|
|
78
|
X
|
|
|
79
|
17.5
|
|
|
245
|
6.1
|
|
|
248
|
X
|
|
|
250
|
14.5
|
|
|
255
|
X
|
|
|
252
|
X
|
|
|
102
|
7.9
|
Notes:
“X” means not working any more.
tonzi
|
7931AFE
|
402165
|
574B4B
|
402FF3
|
574632
|
7A432E
|
7A3C6E
|
7A3B40
|
7A4AAA
|
3/27/2009
|
86
|
|
|
|
|
|
|
|
|
|
SM
|
|
|
|
|
|
|
|
|
0-15
|
34.3
|
12.0
|
42.8
|
28.2
|
25.0
|
29.9
|
23.2
|
20.3
|
16.2
|
15-30
|
39.1
|
35.6
|
50.0
|
29.9
|
26.8
|
22.8
|
26.8
|
28.9
|
18.2
|
30-45
|
40.8
|
40.8
|
39.7
|
42.1
|
36.3
|
27.6
|
26.8
|
32.1
|
32.1
|
45-60
|
40.2
|
53.0
|
41.4
|
44.0
|
41.4
|
31.7
|
39.1
|
46.0
|
26.5
|
|
|
|
|
|
|
|
|
|
|
|
A6D882B
|
A3D04E8
|
A6D72F5
|
|
|
|
|
|
|
|
|
|
|
|
|
|
|
|
|
0-15
|
39.9
|
23.8
|
16.9
|
|
|
|
|
|
|
15-30
|
50.0
|
23.7
|
29.9
|
|
|
|
|
|
|
30-45
|
39.8
|
32.9
|
36.0
|
|
|
|
|
|
|
45-60
|
41.4
|
40.1
|
49.1
|
|
|
|
|
|
|
|
|
|
|
|
|
|
|
|
|
vaira
|
57318a
|
7933dee
|
|
|
|
|
|
|
|
0-15
|
12.6
|
14.1
|
|
|
|
|
|
|
|
15-30
|
19.0
|
22.5
|
|
|
|
|
|
|
|
30-45
|
20.4
|
25.3
|
|
|
|
|
|
|
|
45-60
|
28.7
|
33.3
|
|
|
|
|
|
|
|

|
Field Data
No tank data
Well Depth
| Date | Location | Depth (feet) |
|---|
| 2009-03-27 | TZ_floor | 26.76 |
| 2009-03-27 | TZ_road | 34.67 |
| 2009-03-27 | TZ_tower | 30.63 |
No TZ Moisture Point data found
No VR Moisture Point data found
No TZ grass heigth found
No VR grass heigth found
Tree DBH
| Date | Tag# | Reading (mm) |
|---|
| 2009-03-27 | 1 | 10.4 |
| 2009-03-27 | 102 | 6.8 |
| 2009-03-27 | 2 | 9.1 |
| 2009-03-27 | 245 | 6.2 |
| 2009-03-27 | 250 | 14.7 |
| 2009-03-27 | 3 | 12.5 |
| 2009-03-27 | 4 | 4.6 |
| 2009-03-27 | 5 | 10.4 |
| 2009-03-27 | 6 | 6.2 |
| 2009-03-27 | 7 | 11.6 |
| 2009-03-27 | 8 | 12.9 |
No water potential data found
No TZ Grass Biomass data found
No TZ OakLeaves Biomass data found
No TZ PineNeedles Biomass data found
0 photos found
16 sets found
No data found for TZ_Fenergy.
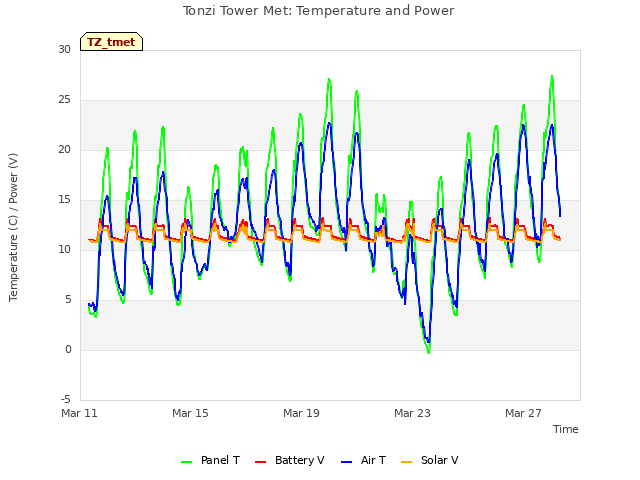
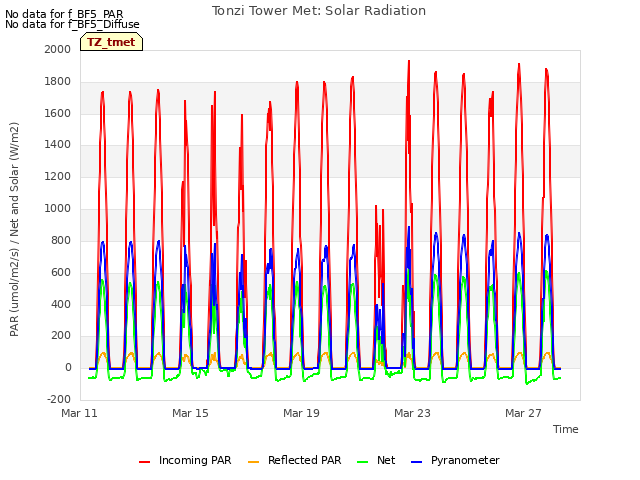
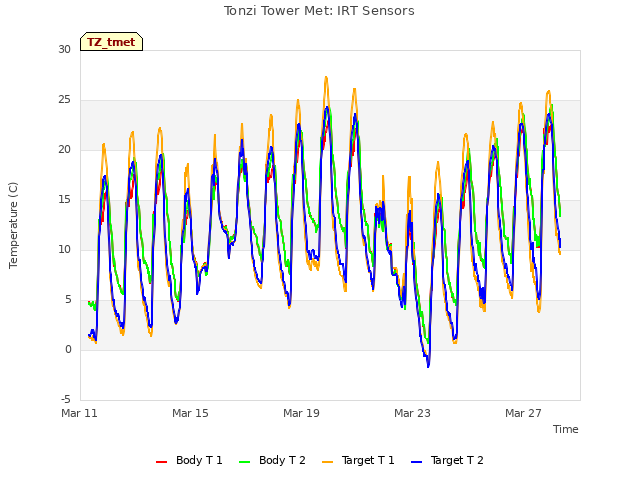
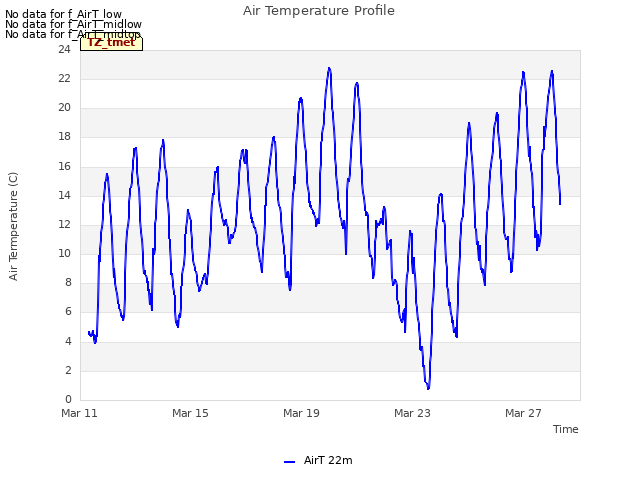
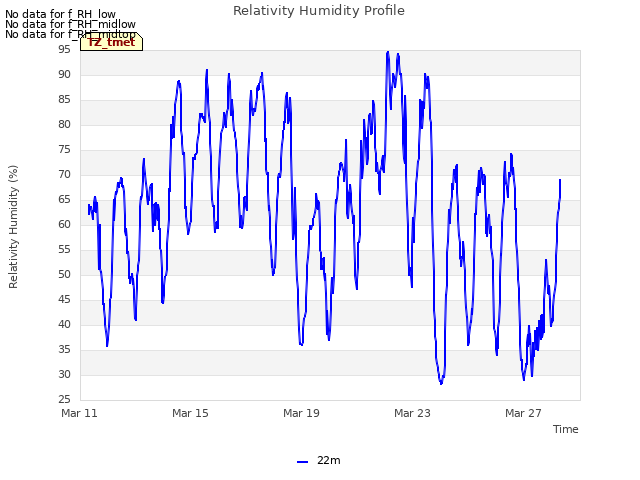
11 TZ_tmet graphs found


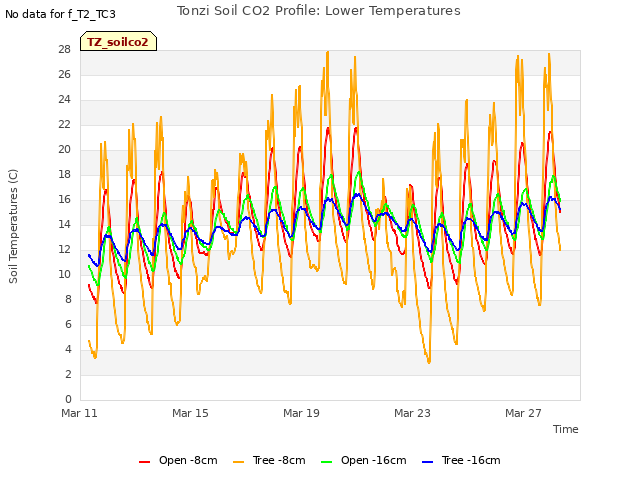
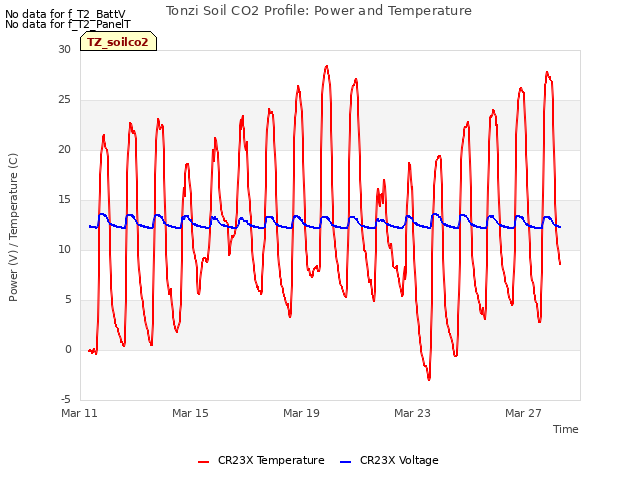
11 TZ_soilco2 graphs found


Can't check TZ_mixed
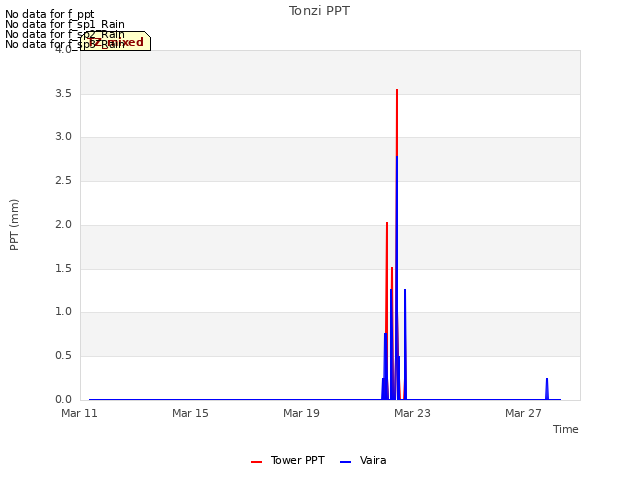
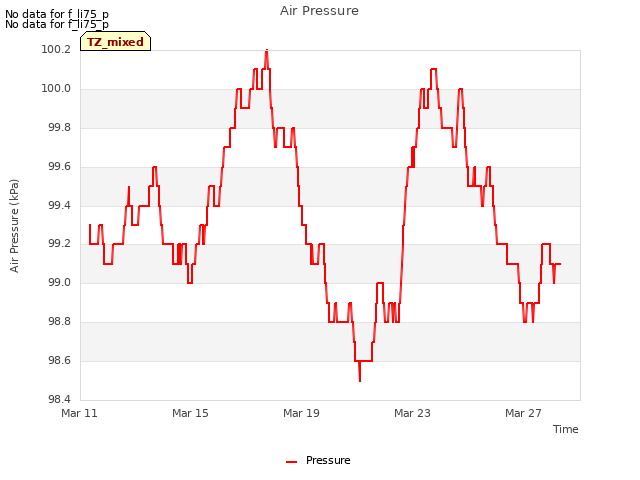
3 TZ_mixed graphs found

No data found for TZ_fflux.
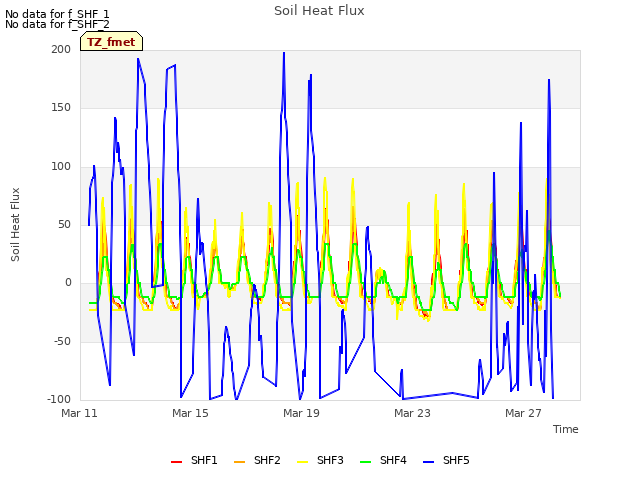
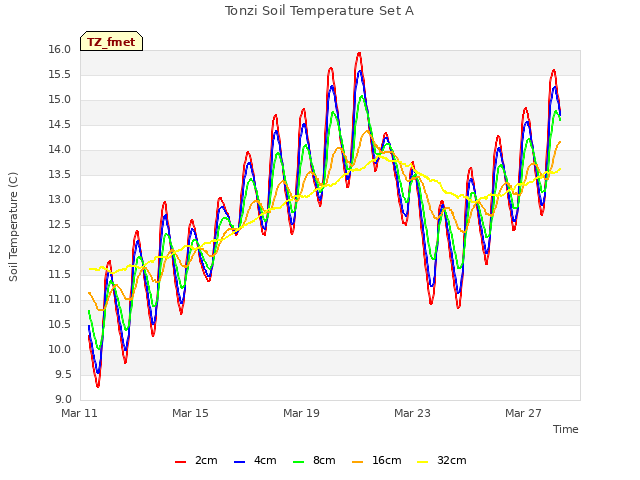
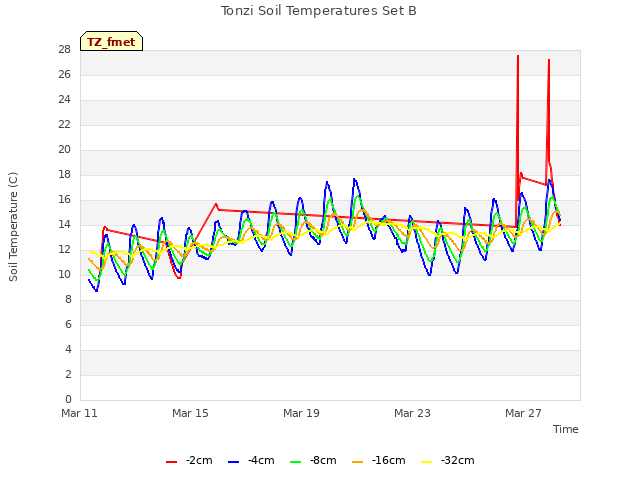
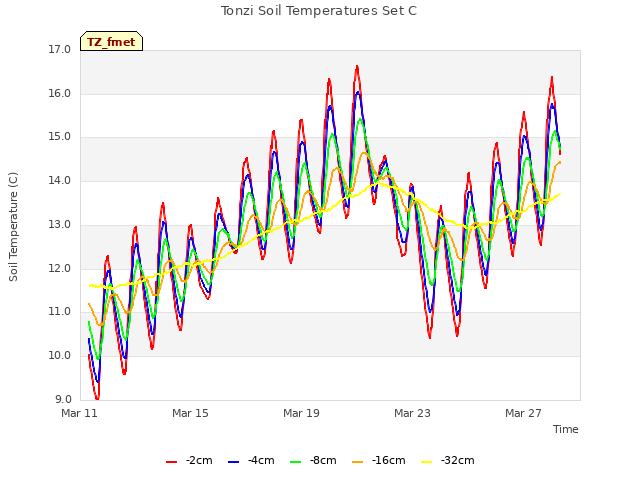
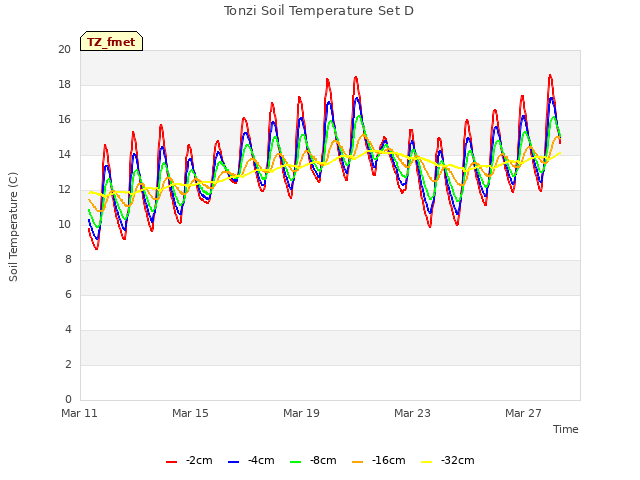
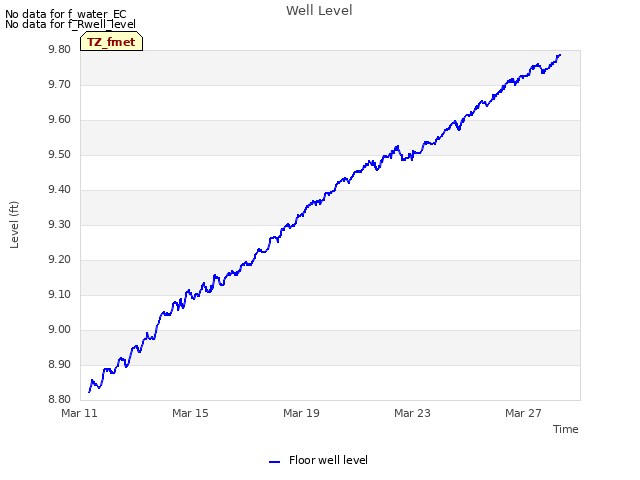
8 TZ_fmet graphs found


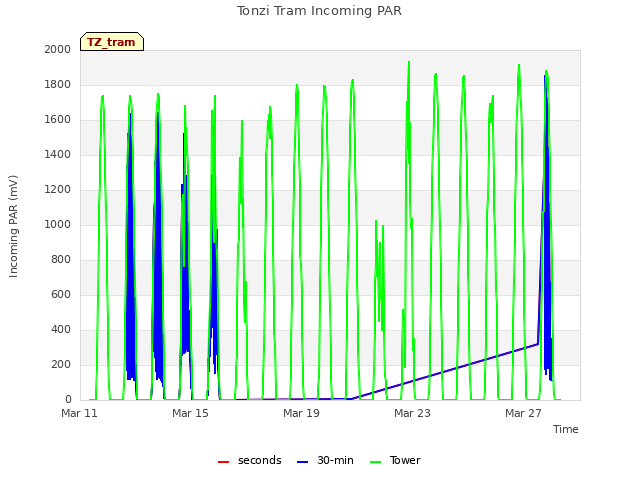
1 TZ_tram graphs found
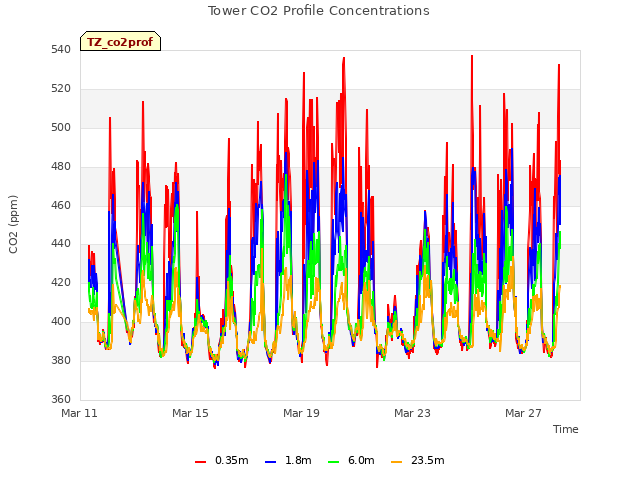
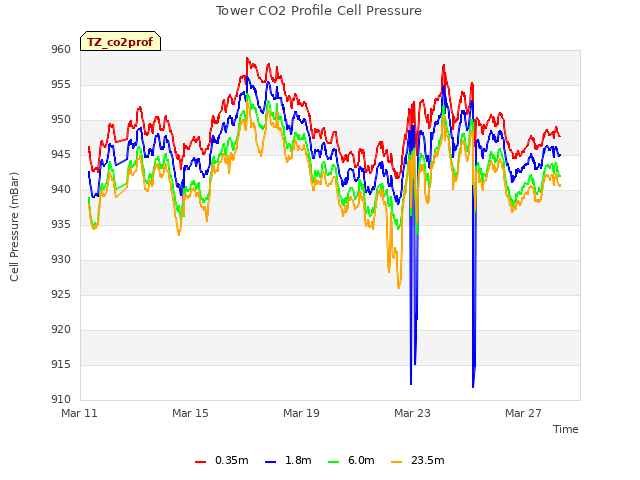
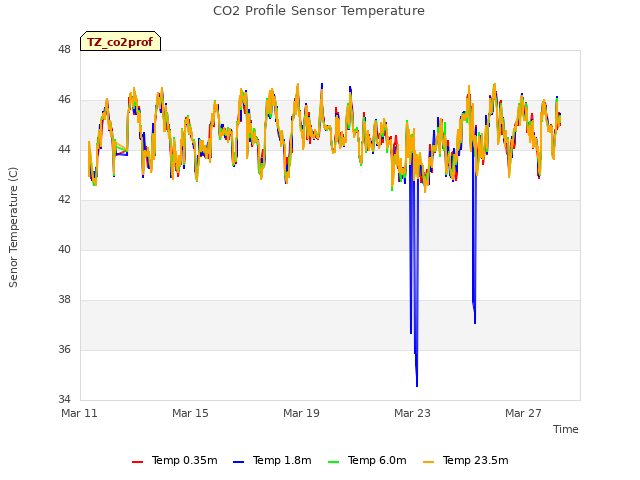
3 TZ_co2prof graphs found
No data found for TZ_irt.
No data found for TZ_windprof.
No data found for TZ_tflux.
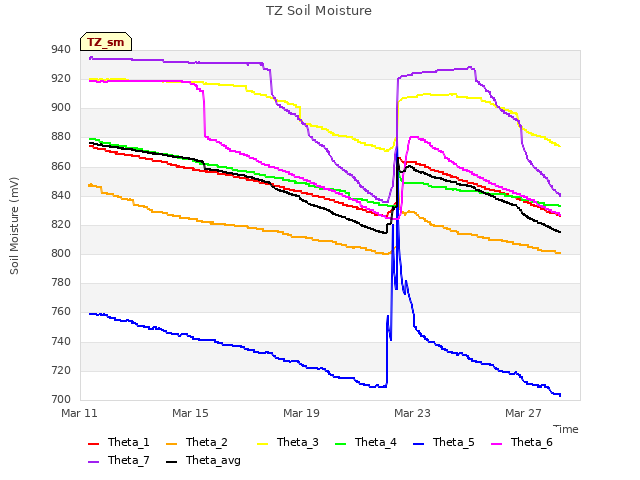
2 TZ_sm graphs found

Can't check TZ_met
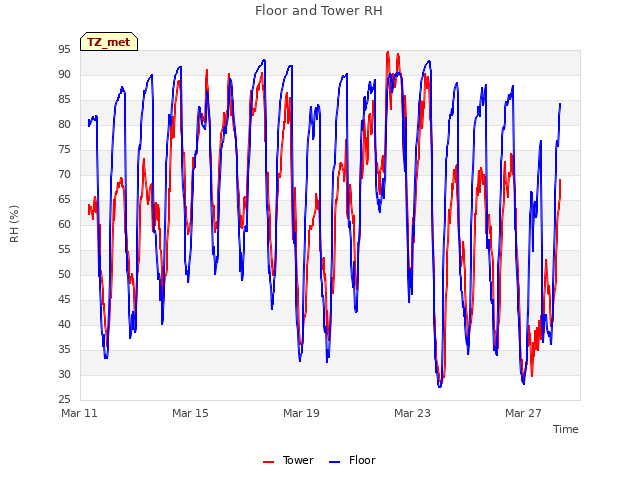
1 TZ_met graphs found
Can't check TZVR_mixed
No data found for TZ_osu.
No data found for TZ_fd.
Tonzi Z-cam data


