
Field Notes
<--2024-12-03 15:00:00 | 2025-01-09 15:00:00-->Other sites visited today: Tonzi
Phenocam link: Searching...
Vaira: 2024-12-17 15:15:00 (DOY 352)
Author: Joe Verfaillie
Others: Kuno
Summary: Solar panel a little askew from wind, lots of cows around, check well EC, went to the pond, moved Li7550 box
| Vaira 2024-12-17 Kuno and I arrived at about 15:15 PST. It had been cold and foggy most of the day but just lifted a little before we arrived. There are puddles on the road and water in the water hole from recent rains. The trees a bare and the grass has sprouted but probably won't grow much until it gets warmer. There were a bunch of mama and baby cows around. The solar panels were a bit ajar - more evidence that there was some heavy wind here. I straightened them out but they could use some new stakes at the bottom where the old wooden stakes have rotted away. I collected the met, flux, FD and camera data. Kuno measured the well including taking a water sample to test with the handheld salinity meter which read near zero. We also moved the Licor 7550 box from the vertical post facing west to the angled leg to the north. I'm hoping this will reduce the solar load on the box and the temperature sensor on the bottom of the box. The 7500 read: 437.5ppm CO2, 489.0mmol/m3 H2O, 16.7C, 100.6kPa, 99.3SS We went to the pond. The water level is still low but has come up a little. We left at about 16:00 PST |
Field Data
No tank data
Well Depth
| Date | Location | Depth (feet) |
|---|---|---|
| 2024-12-17 | TZ_floor | 30.35 |
| 2024-12-17 | TZ_road | 38.15 |
| 2024-12-17 | TZ_tower | 35.1 |
| 2024-12-17 | VR_well | 60.7 |
| 2024-12-17 | VR_pond | 14.32 |
No TZ Moisture Point data found
No VR Moisture Point data found
No TZ grass heigth found
No VR grass heigth found
No VR Tree DBH found
No water potential data found
No VR Grass Biomass data found
No VR OakLeaves Biomass data found
No VR PineNeedles Biomass data found
2 photos found
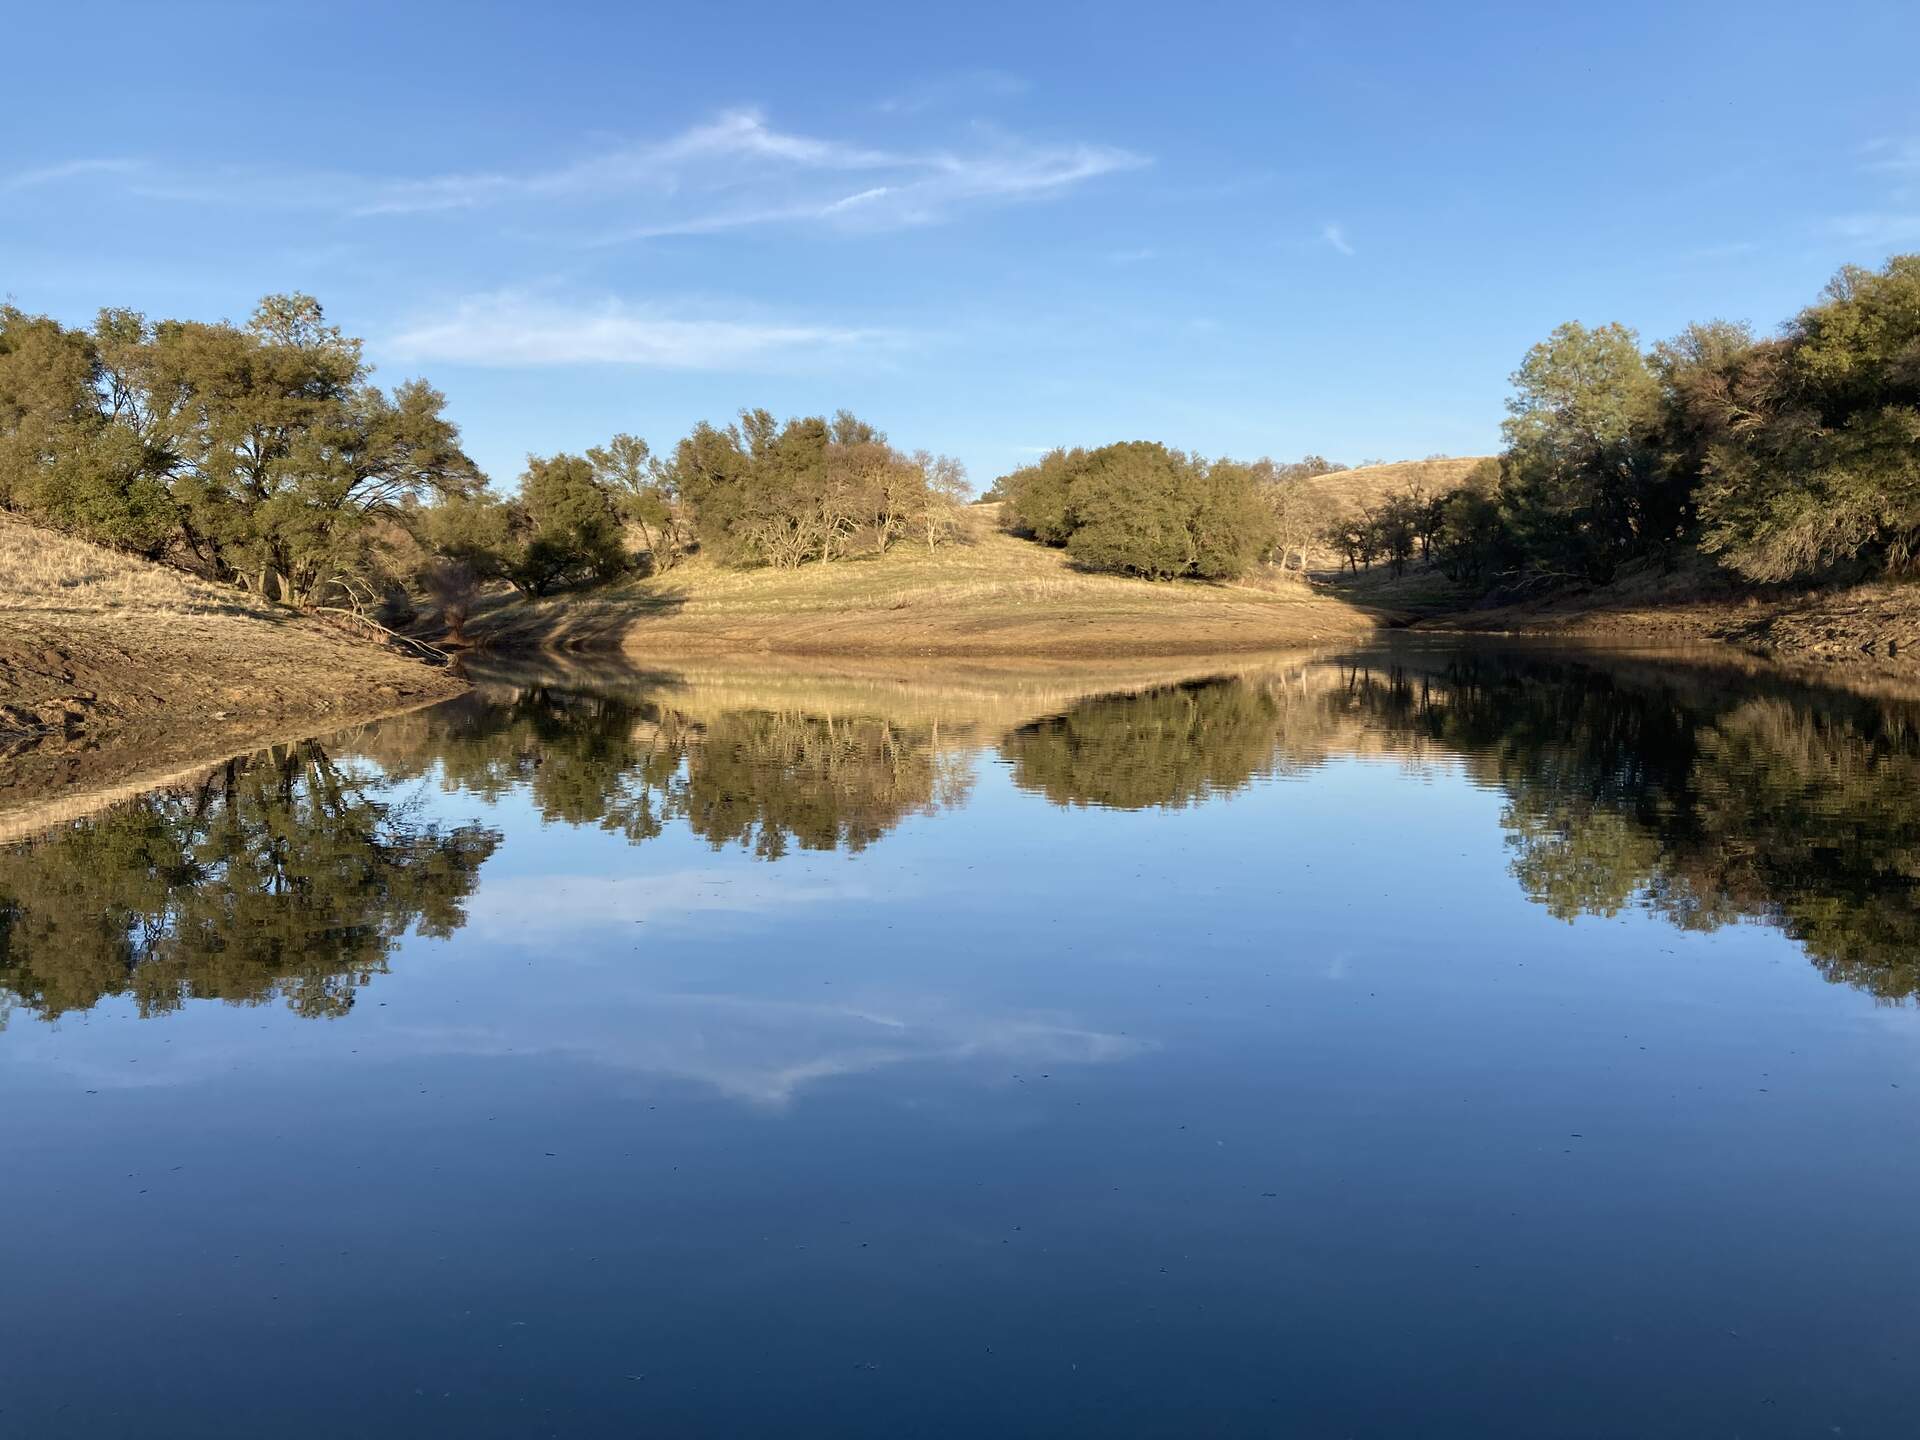
20241217VR_PondReflections.jpg ( 2024-12-17 15:56:38 ) Full size: 1920x1440
Reflections in the pond at Vaira
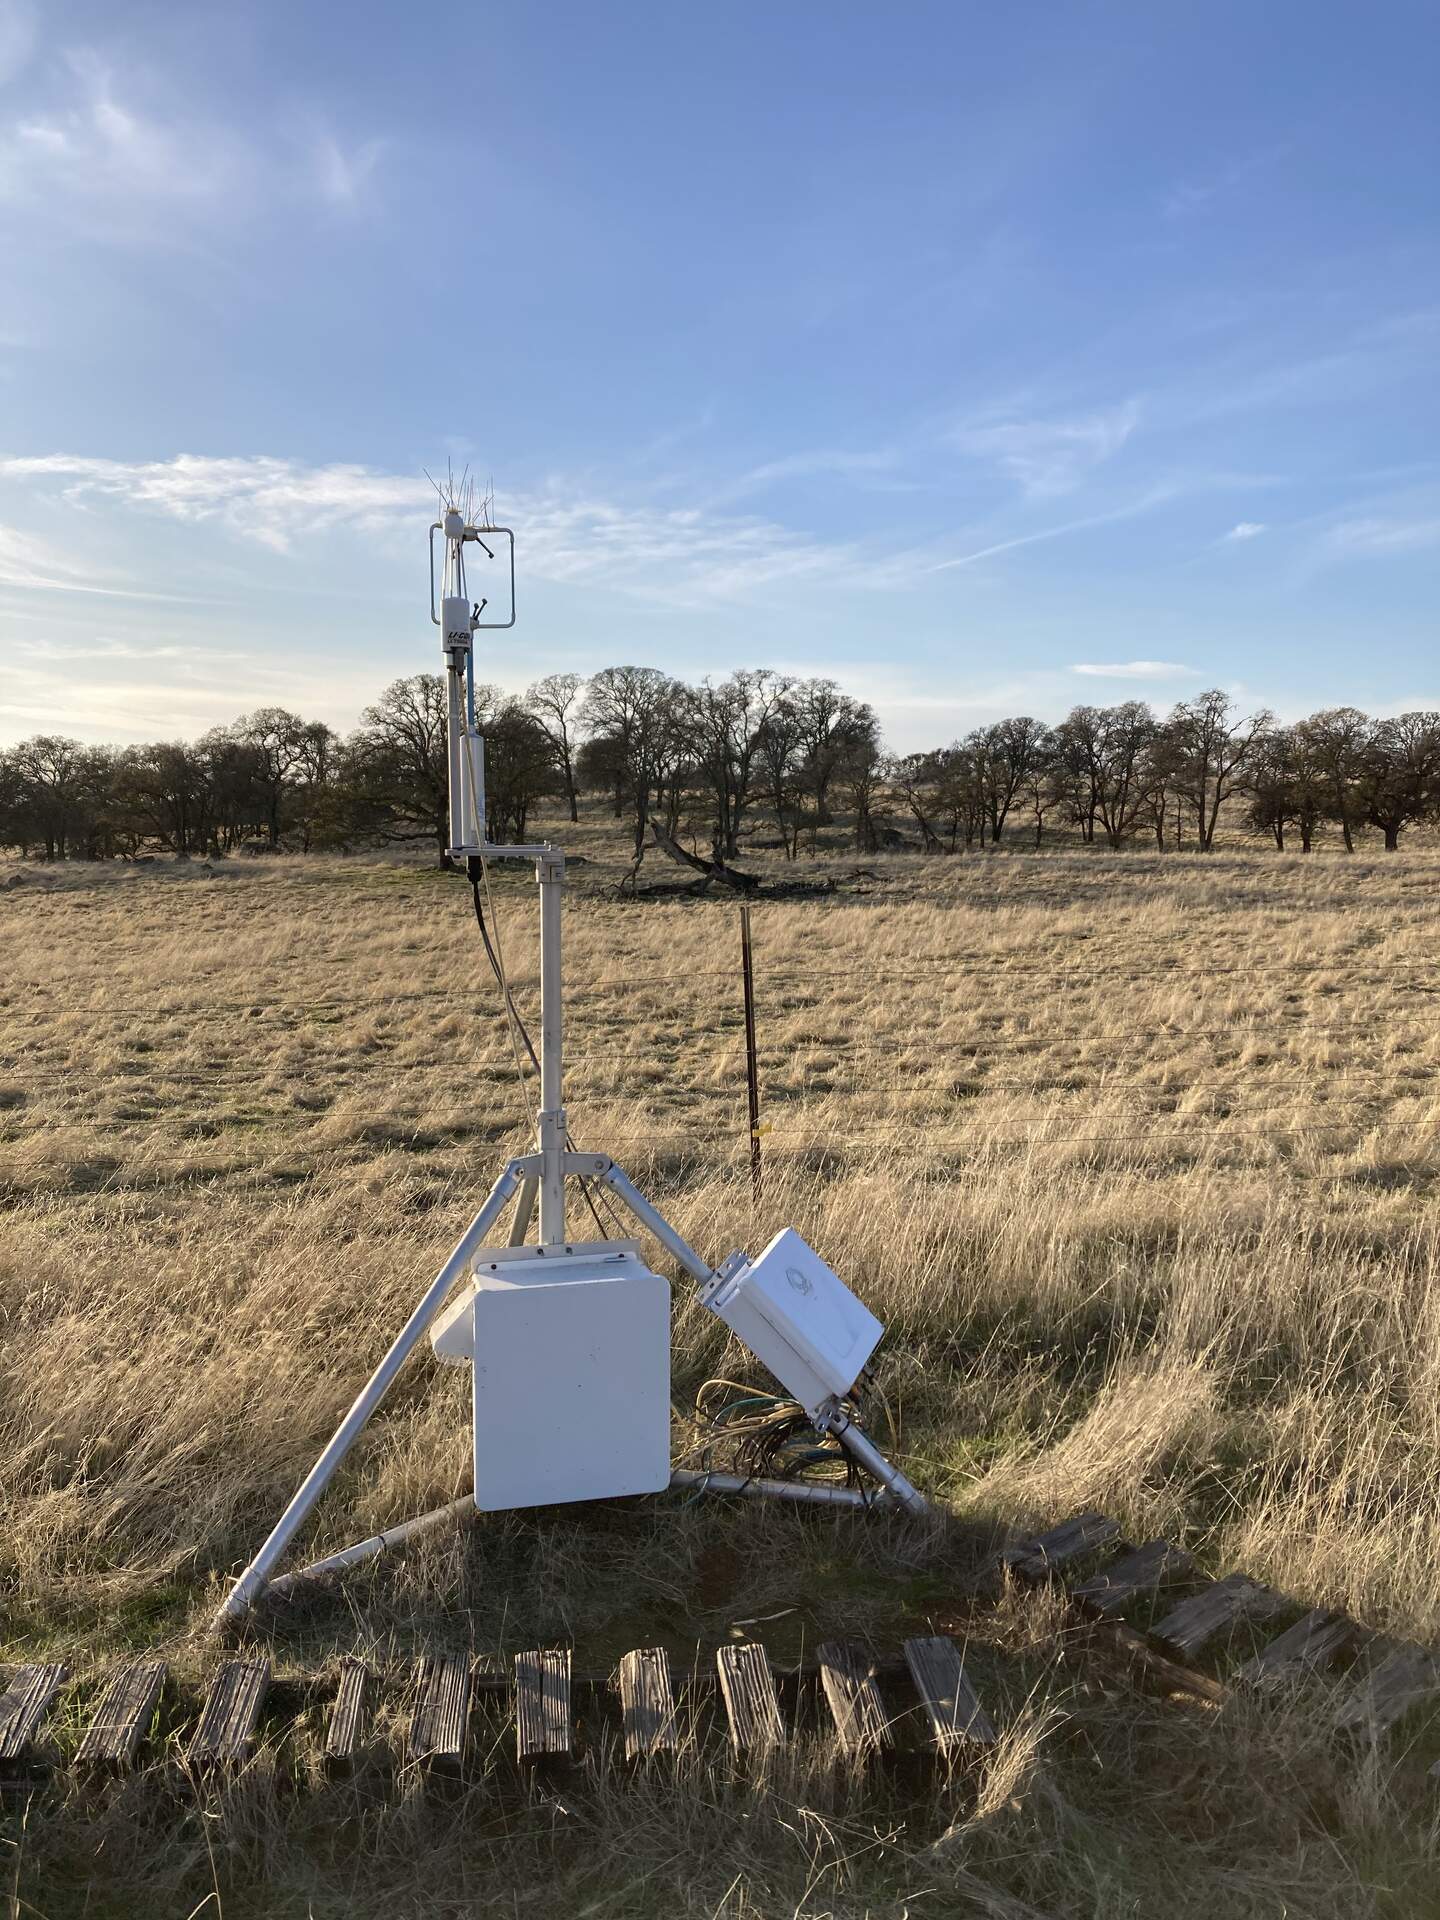
20241217VR_MovedLicorBox.jpg ( 2024-12-17 15:38:14 ) Full size: 1440x1920
Moved the LI7550 box to the leg
9 sets found
16 VR_met graphs found
2 VR_flux graphs found
No data found for VR_soilco2.
2 VR_pond graphs found
Can't check TZVR_mixed
3 VR_fd graphs found
4 VR_processed graphs found
4 VR_arable graphs found
6 VR_soilvue graphs found