
Field Notes
<--2022-06-08 18:15:00 | 2022-07-13 09:45:00-->Other sites visited today: Bouldin Corn | Bouldin Alfalfa
Phenocam link: Searching...
Hill Slough: 2022-06-28 07:20:00 (DOY 179)
Author: Carlos Wang
Others:
Summary: Regular data collection/cleaning, losing power overnight
| I arrived at the site around 07:20 PDT. It was quite windy, but getting sunny with the dissipating haze. There was more water at the site with staff gauge reading at 4.20 FT at around 08:09 PDT. The gauge was difficult to read for me, so I used my phone to get a picture. The LiCOR water tank was about 1/8 empty and I topped the container up. I downloaded the MET data and checked that the data look good. There was around 6sec time difference, and I synced the logger time to the laptop time. Then I downloaded the USB GHG data and checked the ambient conditions: - The 7500 read: 403.6ppm CO2, 619.5mmol/m3 H2O, 17.8C, 101.8kPa - The 7700 read: 1.95ppm CH4 The RSSI was ~42.5 and SS was ~96.5. I went up to clean the MET and flux sensors. The pyranometer had some film. After cleaning the RSSI was ~71.8 and SS was ~98.8. I also downloaded the raspberry picam data, which took a while. The internet kept cutting off, but the .zip file downloaded no problem. After inspecting that all copies were inside of the .zip folder, I then deleted the existing photos. Note from Daphne: Looking at the data back in the lab, the tower is losing power overnight, which is weird b/c the days are long and sunny. We've lost about 10 nights of data in the past two weeks. The power lines and connections need a thorough inspection. Maybe test the batteries, too. |
2 photos found

20220628HS_StaffGauge.jpg ( 2022-06-28 08:09:04 ) Full size: 1440x1920
Sometimes it's easier to read the staff gauge by taking a photo and then zooming in
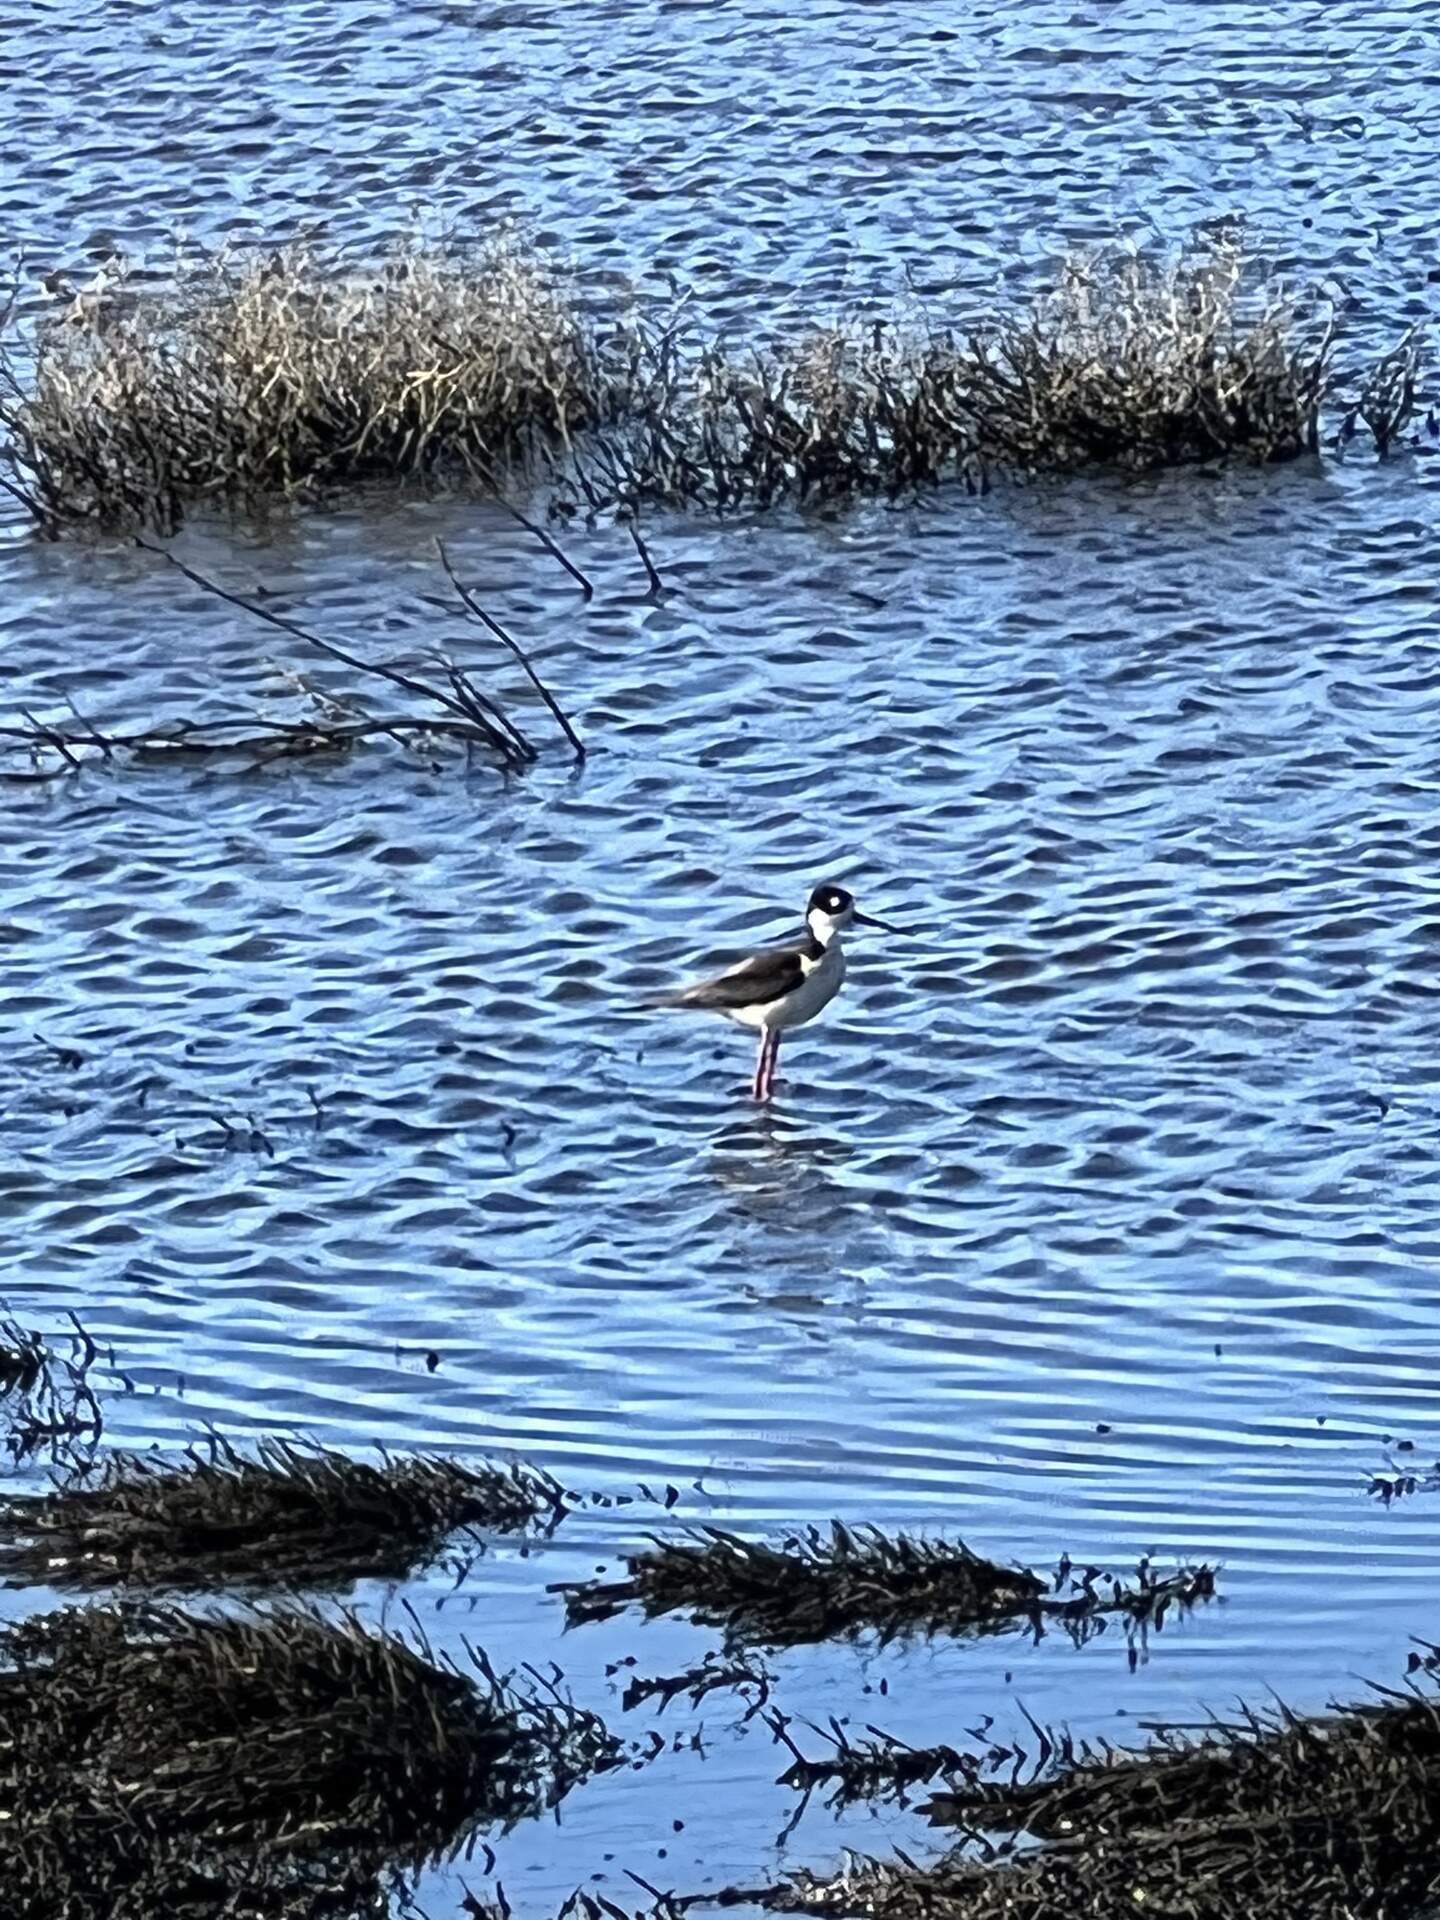
20220628HS_Stilt.jpg ( 2022-06-28 08:25:51 ) Full size: 1440x1920
Black-necked stilt
4 sets found
21 HS_met graphs found
4 HS_flux graphs found
1 HS_cam graphs found
Can't check HS_Processed
2 HS_Processed graphs found