Field Notes
<--2020-05-29 11:00:00 | 2020-06-09 12:50:00-->Phenocam link: Searching...
Bouldin Corn: 2020-06-04 08:00:00 (DOY 156)
Author: Joe Verfaillie
Others:
Summary: Installed Arables, measured LAI, took biomass samples, measured planting density, shadow band motor dead - needs swap
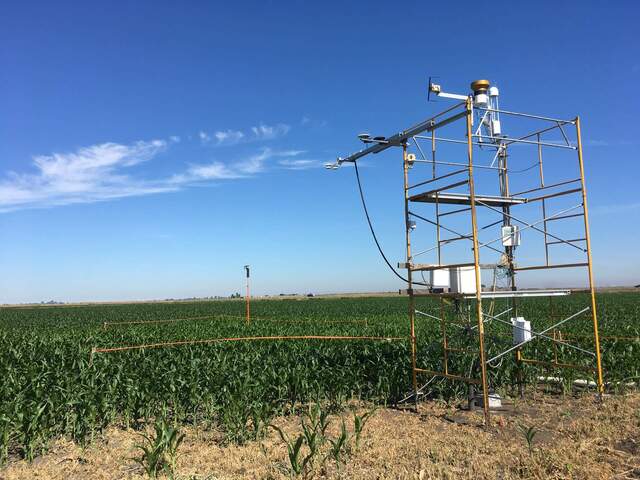
| Bouldin Corn 2020-06-04 I arrived at about 8AM. It was clear sunny and hot with a typical breeze. I saw two tractors working corn fields to the east and west but no evidence that our field had had recent work. Tyler has done a good job defining some rows through the corn forest where his chambers are but still way more dense there. Because there may yet be tractors in our field I decided to put the pair of Arable Mark IIs in the northwest corner of the area that Tyler has marked off for his chambers. I had put them all together in the lab so at the field I just needed to boot them. At first I tried to do one at a time. The first one sn C003771 was taking a long time so I cleared some weeds while I waited – the crop dusting did a good job as nearly all the weeds near the tower are dead and dying. The first Mark unit failed to boot and stopped searching for a cell connection. I gave both units a three second press. The second one booted up quickly and the first one was still acting weird. I did a 15 second reset and it finally booted. I installed them in the field 17.6m at 280 deg from the northwest corner of the scaffolding: sn C003771 is to the east and sn C004318 is to the west. It’s 3.26m to the top of the post – I need to measure the distance to the senor areas. I took single wand LAI measurements. The light was very uniform and the corn is still only about thigh high. I made some measurements near the z-cams and under canopy PAR. Then a couple “above†measurements before making a bunch of measurements across rows of normal density corn. I finished with a few more “above†measurements. After computing the file, the result was about 0.86 LAI. I measured planting density and took six individual plans for biomass and scanned LAI. In three locations with normal planting density I laid out the tape measure perpendicular to the rows and measured the row separation. Then I laid the tape parallel to a row and counted the number of plants in 4m. Then I took two plants from that row for biomass measuring the heights. Row separation: 79,71,80,76,77,77,80,76,73,88,76,77,79,76,76,75,80 = 77.4cm on average Plants in 4m: 25, 25 23 = 6 plants per meter. I cleaned the windows on the z-cams. Just before I left I notice that the shadow band didn’t seem to be spinning. It had power but was frozen in place. We will need to swap the motor next time. I went to check on the Alfalfa field and they had just started mowing it. I would have trimmed the areas around the tower and checked on an Arable device if it was already mowed. I decide to stay out of the way and deal with it next Tuesday. I left at about 11:00 |
1 photos found

20200604BC_ArablesInstalled.jpg ( 2020-06-04 00:00:00 ) Full size: 1920x1440
A pair of Arable Mark IIs were installed for the Planet Labs project
6 sets found
17 BC_met graphs found
5 BC_flux graphs found
Can't check TATWBABCSB_cam
Can't check MBSWEEWPBCBA
No data found for BC_pa.
1 BC_arable graphs found

