Field Notes

<--2019-01-04 10:30:00 | 2019-01-14 10:20:00-->
Phenocam link: Searching...

Tonzi: 2019-01-13 10:00:00 (DOY 13)
Author: Ana Andreu Mendez
Others: Wes (UC Davis)

Summary: Installed new cal panel for the FLIR, Discovered Tower power down due to blown fuse.

Wes and I went yesterday to the field to install the new FLIR cal panel. We used Joe's idea of the concrete panel. We screwed it (6 screws) to a sawhorse that we fixed to the ground with 4 big spikes. We also made 5 holes for the TCs, and attached them from behind. We put concrete putty over them, in the wholes (although they are super thin) and behind. Also over the screws. It's "movable" as Joe suggested, we just have to take the spikes from the ground.

Of the 5 thermocouples, 3 are on the central FOV of the irt, other 2 more near by the edges. We have to check the consistence of the thermocouples measurements, because we realized that the differences on temperature of the panel may be high...but we will see when checking the first round of data and the FLIR photos. There's still more space in the datalogger to add more thermocouples. We did not connected the data logger (CR10X sn 20138) to the solar panel, but to the tiny battery.

The IRT, from the McElrone Lab (Apogee IRT SI-121, sn 1624) was "re-" calibrated before with a Black Body.
http://www.palmerwahl.com/product_home.php?cat=9&catl=23&line=319&itm=5014#
r2 was equal to 0.9989 (f(x)=1.*irt + 0.85). It worked pretty well, although there was some strange behavior around 10 and 0 degrees. At higher temperatures was pretty stable. Could not measure from 17 to 23, but I will try it next time on the field.

We tried not to shadow too much the panel with the pole, although during the afternoon it will, a little.

Field Data

No tank data

No TZ Well data found

No TZ Moisture Point data found

No VR Moisture Point data found

No TZ grass heigth found

No VR grass heigth found

No TZ Tree DBH found

No water potential data found

No TZ Grass Biomass data found

No TZ OakLeaves Biomass data found

No TZ PineNeedles Biomass data found

3 photos found
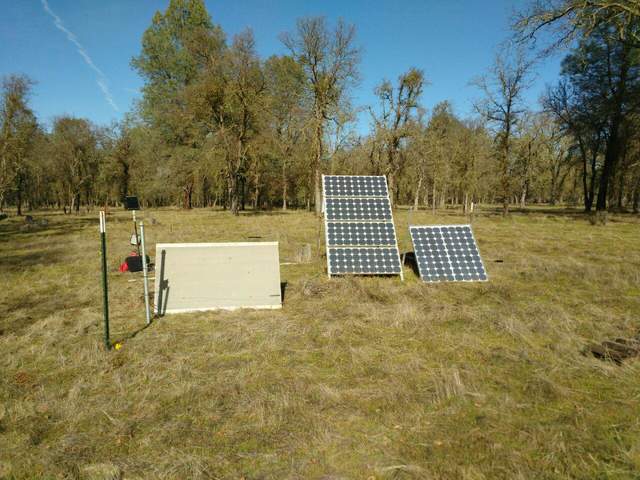
New cal panel for the FLIR camera made from concrete (wonder) board.
20190113TZ_NewFLIRCalPanel.jpg ( 2019-01-13 10:15:03 ) Full size: 1280x960
New cal panel for the FLIR camera made from concrete (wonder) board.
Wes and Ana at Tonzi
20190113TZ_WesAna.jpg ( 2019-01-13 12:45:02 ) Full size: 1280x960
Wes and Ana at Tonzi
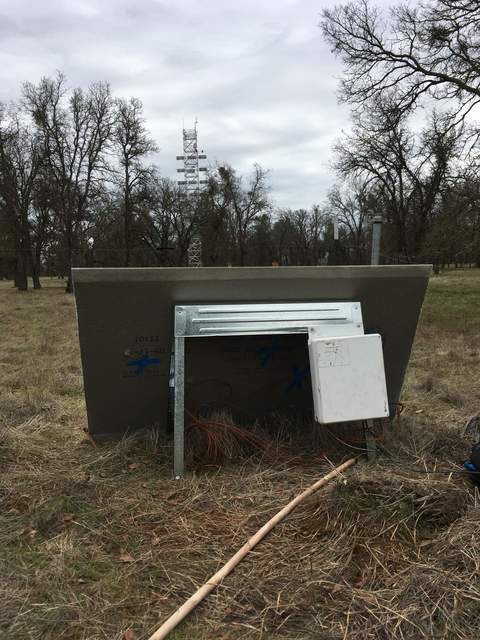
New cal panel for FLIR camera and Tower.
20190114T_NewFLIRCalPanelTower.jpg ( 2019-01-14 12:17:45 ) Full size: 1440x1920
New cal panel for FLIR camera and Tower.

Graphs display:
16 sets found

No data found for TZ_Fenergy.
11 TZ_tmet graphs found

Explore the graph:Tonzi Tower Met: Temperature and Power in a new window

Explore the graph:Tonzi Tower Met: Solar Radiation in a new window

Explore the graph:Tonzi Tower Met: IRT Sensors in a new window

Explore the graph:LED Sensor Incoming in a new window

Explore the graph:LED Sensor Outgoing in a new window

Explore the graph:4-Band Solar Radiation in a new window

Explore the graph:Air Temperature Profile in a new window

Explore the graph:Relativity Humidity Profile in a new window

Explore the graph:Tonzi Tower PRI in a new window

Explore the graph:SRS PRI/NDVI in a new window

Explore the graph:SRS NDVI in a new window

11 TZ_soilco2 graphs found

Explore the graph:Tonzi Soil CO2 Profile: Open (East) CO2 in a new window

Explore the graph:Tonzi Soil CO2 Profile: Tree (West) CO2 in a new window

Explore the graph:Tonzi Soil CO2 Profile: Open (East) Temperatures in a new window

Explore the graph:Tonzi Soil CO2 Profile: Tree (West) Temperatures in a new window

Explore the graph:Tonzi Soil CO2 Profile: Upper CO2 in a new window

Explore the graph:Tonzi Soil CO2 Profile: Lower CO2 in a new window

Explore the graph:Tonzi Soil CO2 Profile: Upper Temperatures in a new window

Explore the graph:Tonzi Soil CO2 Profile: Lower Temperatures in a new window

Explore the graph:Tonzi Soil CO2 Profile: Power and Temperature in a new window

Explore the graph:Tree 2 Soil CO2 in a new window

Explore the graph:Tree 2 Soil Temperature in a new window

Can't check TZ_mixed
3 TZ_mixed graphs found

Explore the graph:Tonzi PPT in a new window

Explore the graph:Tonzi CO2 and H2O Densities in a new window

Explore the graph:Air Pressure in a new window

1 TZ_fflux graphs found

Explore the graph:Tonzi Wind Speed in a new window

8 TZ_fmet graphs found

Explore the graph:Soil Heat Flux in a new window

Explore the graph:Tonzi Soil Temperature Set A in a new window

Explore the graph:Tonzi Soil Temperatures Set B in a new window

Explore the graph:Tonzi Soil Temperatures Set C in a new window

Explore the graph:Tonzi Soil Temperature Set D in a new window

Explore the graph:Well Level in a new window

Explore the graph:Well Water Temperature in a new window

Explore the graph:Soil Water Potential in a new window

No data found for TZ_tram.
3 TZ_co2prof graphs found

Explore the graph:Tower CO2 Profile Concentrations in a new window

Explore the graph:Tower CO2 Profile Cell Pressure in a new window

Explore the graph:CO2 Profile Sensor Temperature in a new window

1 TZ_irt graphs found

Explore the graph:Surface Temperatures in a new window

No data found for TZ_windprof.
1 TZ_tflux graphs found

Explore the graph:Tower CO2 and H2O in a new window

2 TZ_sm graphs found

Explore the graph:Floor Solar Radiations in a new window

Explore the graph:TZ Soil Moisture in a new window

Can't check TZ_met
1 TZ_met graphs found

Explore the graph:Floor and Tower RH in a new window

Can't check TZVR_mixed
8 TZ_osu graphs found

Explore the graph:Soil Moisture And Rain in a new window

Explore the graph:SP1 Solar Radiation in a new window

Explore the graph:SP1 Soil Temperature Profile in a new window

Explore the graph:SP1 Soil Heat Flux in a new window

Explore the graph:SP2 Soil Moisture in a new window

Explore the graph:SP2 Soil Temperature in a new window

Explore the graph:SP3 Soil Moisture in a new window

Explore the graph:SP3 Soil Temperature in a new window

No data found for TZ_fd.
Tonzi Z-cam data

plot of Tonzi z-cam LAI

plot of Tonzi z-cam gap fration