Field Notes
<--2006-11-29 00:00:00 |
2006-12-19 00:00:00-->
Phenocam link:
Searching...Tonzi: 2006-12-07 09:40:00 (DOY 341)
Author: Siyan Ma
Others:
When: Date: 12/7/2006 , Day: 341 ,
Watch Time: 9:40am .
Where: Tonzi/Vaira Ranch
Who: Siyan
Weather:
clear, a few white, light clouds, very foggy on Hwy 4
Phenology:
grass germination, 3-4cm tall in Varia, 1-3cm tall in Tonzi. Oak leaves have
fallen off. Grass didn’t change very
much since last visit.
Summary
- check and download data at
Tower, Floor, and Varia. EC systems
worked well. Power looks OK in
three sites.
- grass sample for LAI and
phenology in Vaira and Tonzi. Try
to quantify litter-mass.
- Measured groundwater, dendrometer,
and spectrometer. Dendrometers need
reset because some have been out of range!!!
Groundwater:
roadside 36.58 ft
tower 31.92 ft
understory 26.67 ft
Vaira_Grass
Site
- Fence and gate power: >12 v.
- Panel and Batteries: 14.0 v; 14.1 amps; 3.5 amps.
- Reading from Gillsonic screen
before downloading data. (The value
of H2O and CO2 should be in the range of 0 – 5 v.)
Time
|
09:58:40
|
Path/File name
|
D:\Data\V06_ 340
.flx
D:\Data\VR06 3401200 .raw
|
|
mean
|
std
|
|
mean
|
std
|
w
|
-0.2
|
0.534
|
Ts
|
16.25
|
|
u
|
-0.68
|
0.767
|
H2O
|
1.45
|
0.012
|
v
|
0.33
|
0.15
|
CO2
|
2.15
|
0.005
|
|
|
|
TC
|
1.433
|
0.014
|
- downloading data OK
- check the fans of air temp.
and relative humidity sensors at Vaira. OK
- Check MD-9 system connections
OK
- Closed gate and set up fence.
OK
Tonzi_Tower Site
- Fence and gate power: >12 v.
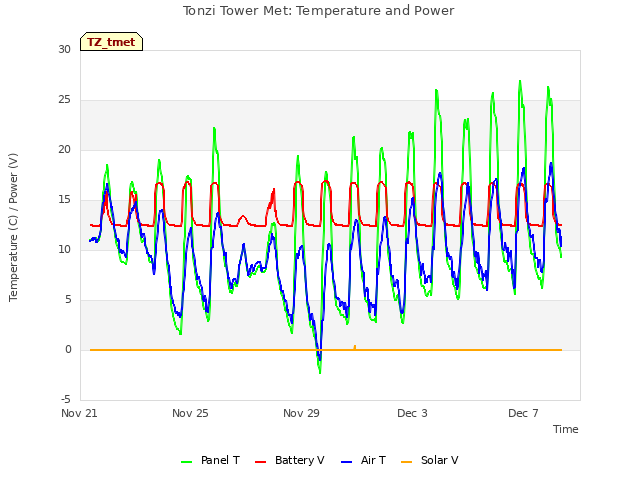
- Panel and Batteries: 13.3 v; 0.0 amps; 5.5 amps.
- Reading from Gillsonic screen
before downloading data. (The value
of H2O and CO2 should be in the range of 0 – 5 v.)
Time
|
10:53:28
|
Path/File name
|
D:\Data\T06_ 340 .flx
D:\Data\TW063410900 .raw
|
|
mean
|
std
|
|
mean
|
std
|
w
|
0.05
|
0.036
|
Ts
|
19.8
|
0.512
|
u
|
3.04
|
0.686
|
H2O
|
2.98
|
0.024
|
v
|
0.08
|
0.509
|
CO2
|
2.36
|
0.023
|
- downloading data OK
- check the fans of air temp.
and relative humidity sensors on the tower and the floor.
- Check calibration cylinders;
CO 2 1500 psig; flow 18
psi.
N 2 1500
psig; flow 20 psi.
Manually calibrate Li-800. Following Ted’s instruction: H:\IoneSavanna_2004\Tower_2004\CO2Profile\LI800_Calibration_Procedure_2Nov04.txt
Is the pump running OK
- close gate and set up fence. OK
Toniz_Floor
Site
- Fence and gate power: >12 v.
- Panel and Batteries: 13.6
v; 16.7 amps; 1.8 amps.
- Reading from Gillsonic screen
before downloading data. (The value
of H2O and CO2 should be in the range of 0 – 5 v.)
Time
|
11:48:10
|
Path/File name
|
D:\Data\F06_ 334 .flx
D:\Data\FL06
3341300 .raw
|
|
mean
|
std
|
|
mean
|
std
|
w
|
0.11
|
0.205
|
Ts
|
18.3
|
1.283
|
u
|
-0.80
|
0.833
|
H2O
|
1.93
|
0.037
|
v
|
0.52
|
0.225
|
CO2
|
1.984
|
0.037
|
- downloading data
- Check MD-9 system connections
OK
CR23X3 – floor-Met
CR23X5 – soil CO 2
profile
CR23X6 – tower-Met
CR10X2 – floor-Met
CR10X4 – sap-flow
CR10X7 – CO 2 profile
CR10X8 – wind profile
Tz12 – sap-flow2: only one file
(Day 334) downloaded to floor PC.
- Soil CO2 profile
Reading
from datalogger
Panel
temp
|
23.05
|
|
|
Battery
voltage
|
13.52
|
|
|
CO2E_1
|
487
|
TCE_1
|
15.8
|
CO2W_1
|
337
|
TCW_1
|
21.04
|
CO2E_2
|
504
|
TCE_2
|
19.5
|
CO2W_2
|
495
|
TCW_2
|
15.83
|
CO2E_3
|
580.5
|
TCE_3
|
11.5
|
CO2W_3
|
788
|
TCW_3
|
13.51
|
CO2E_4
|
773.6
|
TCE_4
|
8.15
|
CO2W_4
|
923
|
TCW_4
|
14.84
|
- soil moisture (TDR) wasn’t
measured because I forgot loading the machine. Sorry.
- Close gate and set up fence.
Tonzi
|
|
|
|
Dendrometer
|
|
|
|
|
|
|
Date
|
Day
|
Tag #
|
Reading (cm)
|
12/7/2006
|
341
|
71
|
22.5
|
|
|
72
|
23.4
|
|
|
77
|
Broken
|
|
|
78
|
Broken
|
|
|
79
|
23.3
|
|
|
245
|
22.5
|
|
|
248
|
24.9
|
|
|
250
|
21.7
|
|
|
255
|
20.5
|
|
|
252
|
missing
|
|
|
102
|
Broken
|
Sample sheet for MIBA
Sample vial
|
What
|
MIBA-US-03.-
|
Leave 1
|
MIBA-US-03.-
|
Leave 2
|
MIBA-US-03. _198_
|
Grass 1
|
MIBA-US-03. 199
|
Grass 2
|
MIBA-US-03. 200
|
Soil in 10 cm
|
MIBA-US-03. 201
|
Stem 1
|
MIBA-US-03. 202
|
Stem 2
|
|
Field Data
No tank data
No TZ Well data found
No TZ Moisture Point data found
No VR Moisture Point data found
No TZ grass heigth found
No VR grass heigth found
No TZ Tree DBH found
No water potential data found
No TZ Grass Biomass data found
No TZ OakLeaves Biomass data found
No TZ PineNeedles Biomass data found
0 photos found
16 sets found
No data found for TZ_Fenergy.
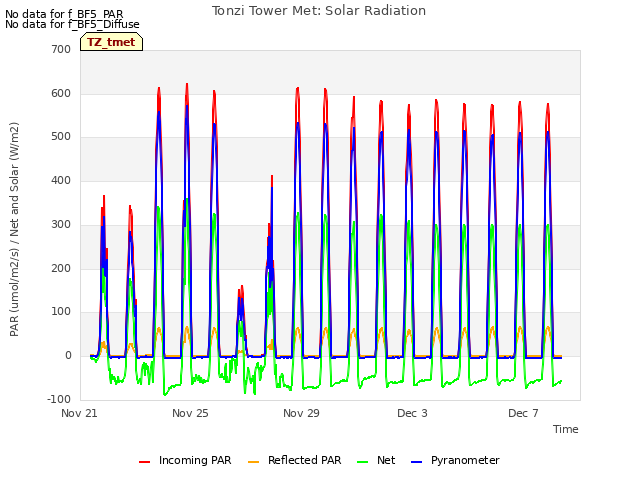
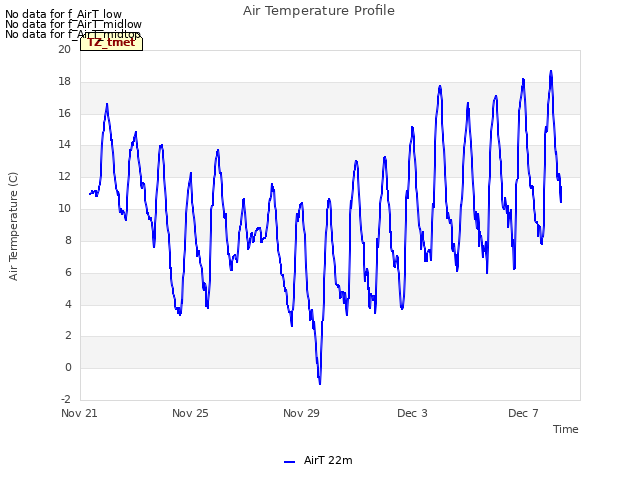
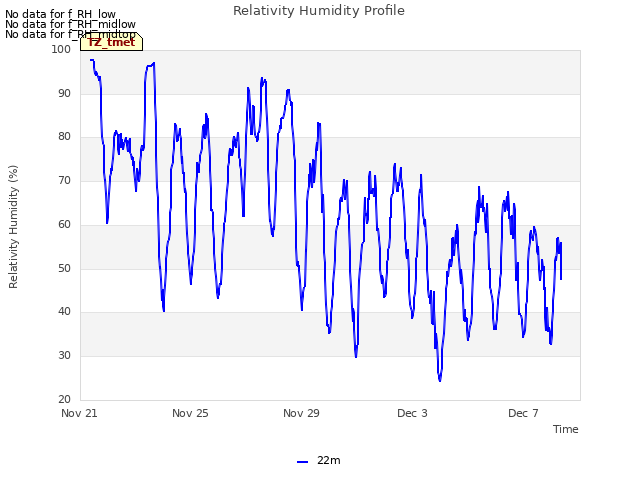
11 TZ_tmet graphs found


No data found for TZ_soilco2.
Can't check TZ_mixed
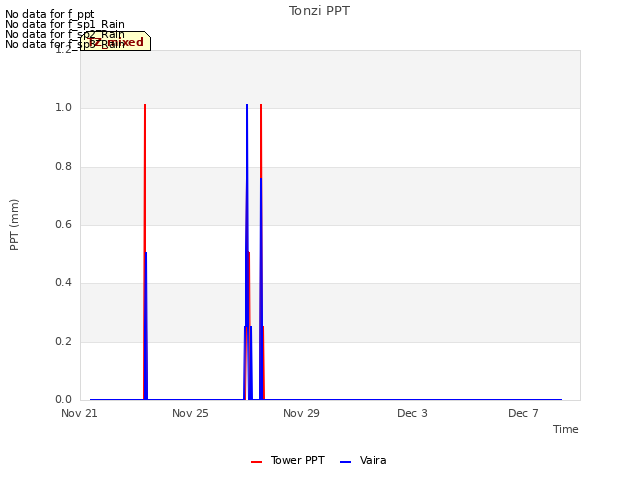
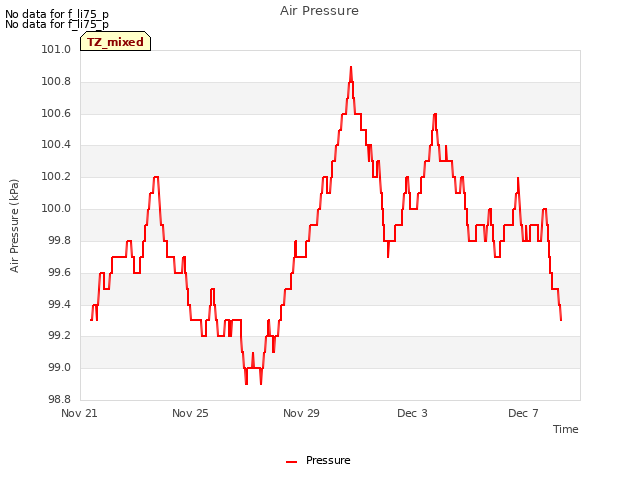
3 TZ_mixed graphs found

No data found for TZ_fflux.
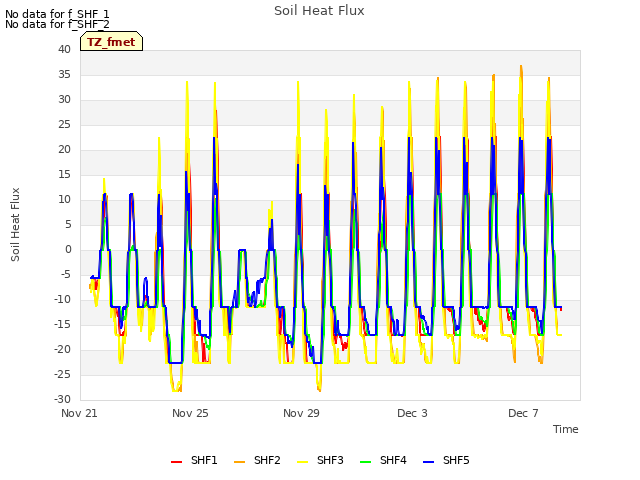
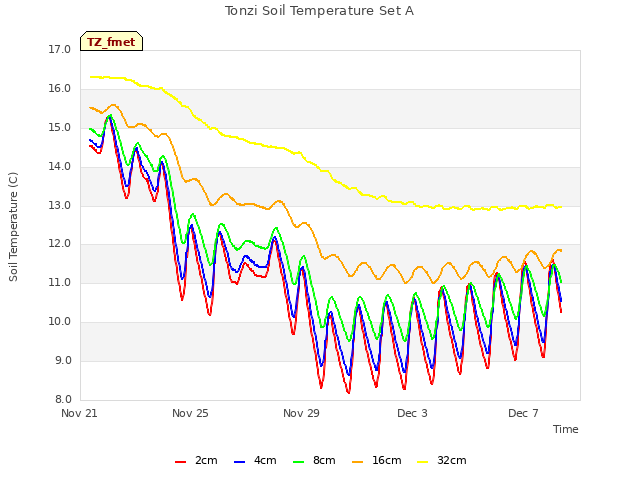
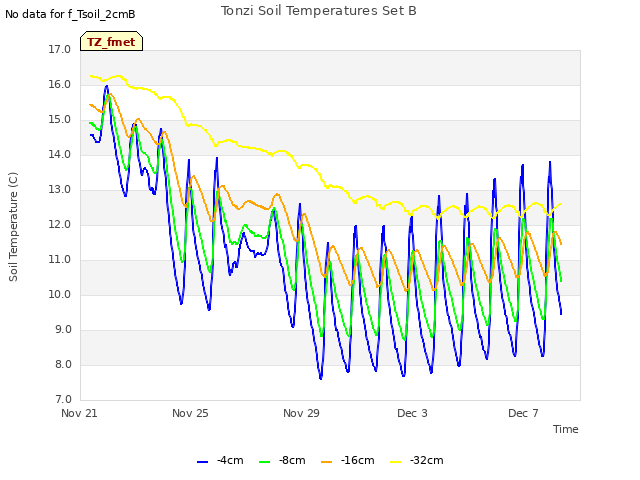
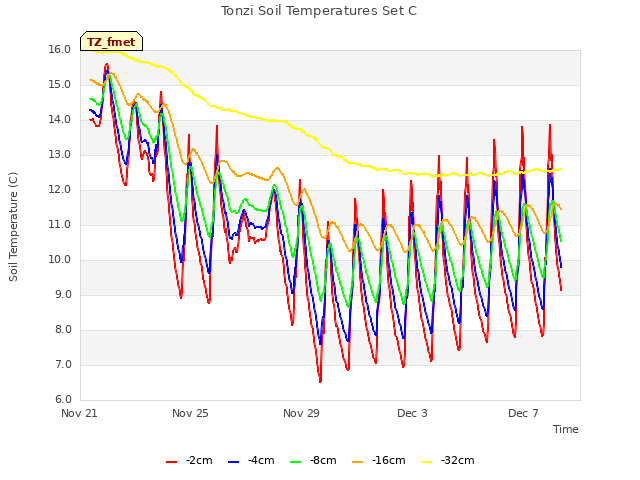
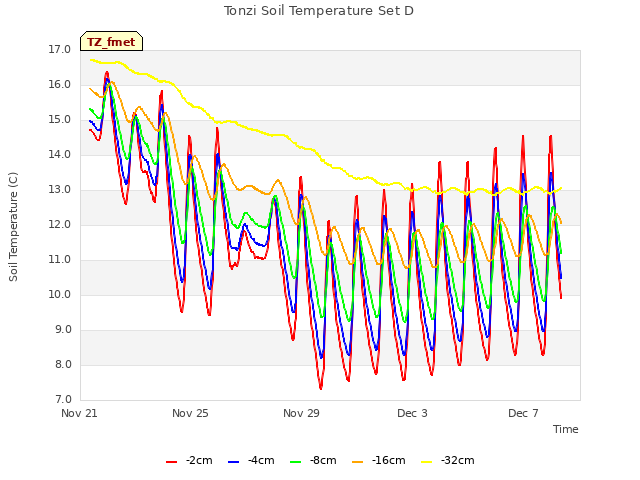
8 TZ_fmet graphs found


No data found for TZ_tram.
No data found for TZ_co2prof.
No data found for TZ_irt.
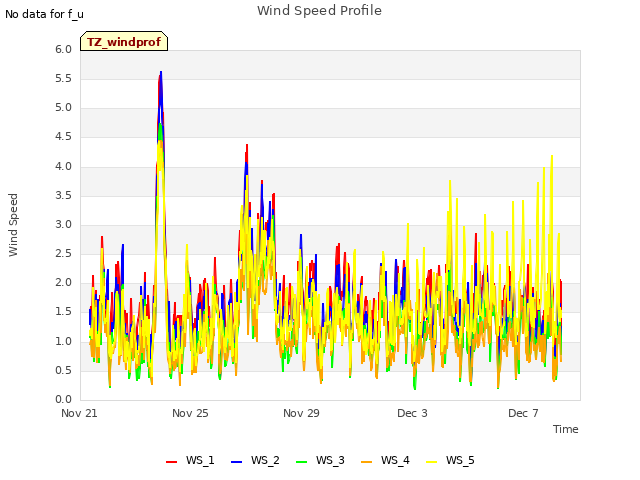
1 TZ_windprof graphs found
No data found for TZ_tflux.
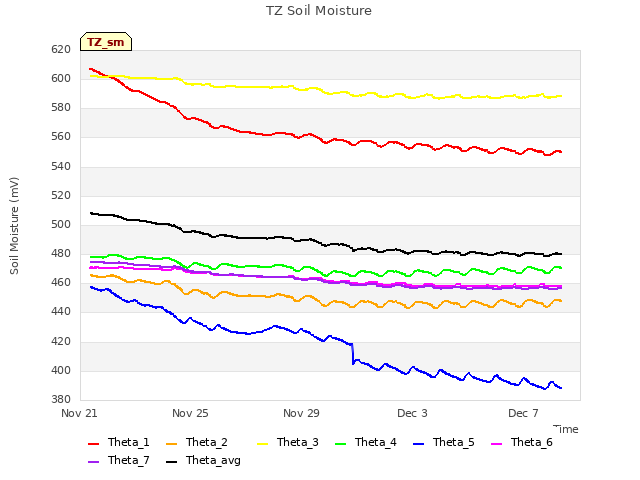
2 TZ_sm graphs found

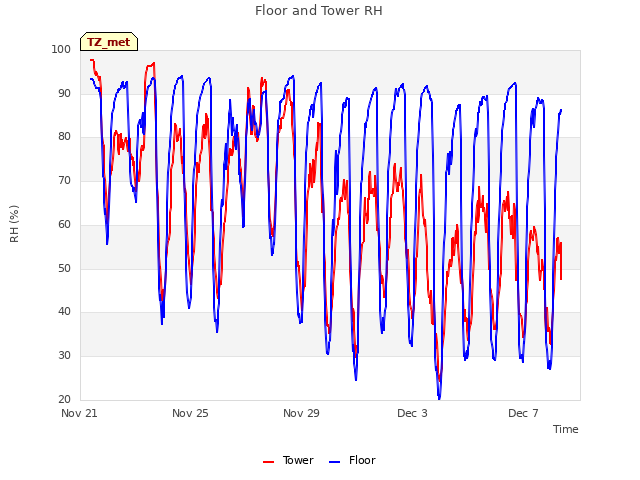
Can't check TZ_met
1 TZ_met graphs found
Can't check TZVR_mixed
No data found for TZ_osu.
No data found for TZ_fd.
Tonzi Z-cam data


