Field Notes
<--2005-12-29 10:20:00 |
2006-01-20 00:00:00-->
Phenocam link:
Searching...Tonzi: 2006-01-10 11:00:00 (DOY 10)
Author: Siyan Ma
Others:
When: Date: 1/10/2006 , Day: 10 , Watch Time: 11:00am .
Where: Tonzi/Vaira Ranch
Who: Siyan
Weather:
clear, breeze
Phenology:
green grass
Summary
- Tower’s Li-7500 readings were
too low. Matthias and I reset
power, but no use. Later on, Ted
found there was bird crap on the sensor and fixed the problem.
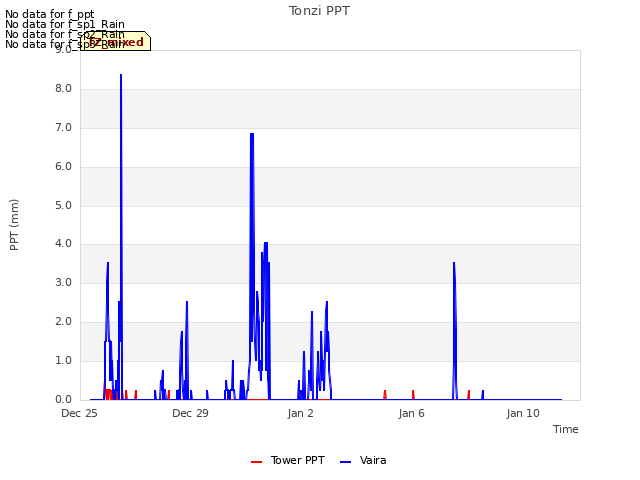
- Rain Gage was full of water.
Need to be fixed.
- CO2 profile: Maybe it is time
to replace calibration cylinders!!
- Vaira Met data were download
to PC once in a while, not day by day.
- Floor site, CD drive may
cause the problem. Later on, talk
to Ted. He said it is possible that
running CD drove too much current.
Sometimes the current is not good enough to do the job and then
cause the restart failed.
- Soil CO2 profile system
- collected oak woody and grass
samples in Tonzi (Alex)
- measured soil moisture
- read dendrometers
Vaira_Grass
Site
- Fence and gate power: >12 v.
- Panel and Batteries: 13.7 v; 21.1 amps; 3.1 amps.
- Reading from Gillsonic screen
before downloading data. (The value
of H2O and CO2 should be in the range of 0 – 5 v.)
Time
|
11:02:16
|
Path/File name
|
D:\Data\V06_010.flx
D:\Data\VR06101100.raw
|
|
mean
|
std
|
|
mean
|
std
|
w
|
0.30
|
0.148
|
Ts
|
15.8
|
0.539
|
u
|
0.92
|
1.145
|
H2O
|
2.186
|
0.066
|
v
|
1.40
|
0.6
|
CO2
|
2.097
|
0.011
|
- downloading data
- check the fans of air temp.
and relative humidity sensors at Vaira. Good!
- Check MD-9 system connections: “BUSY IN COM”, met data were
download to PC once in a while, not day by day. Sys_vot and PC_start were not able to check from the
keyboard.
- Closed gate and set up fence.
Tonzi_Tower Site
- Fence and gate power: >12 v.
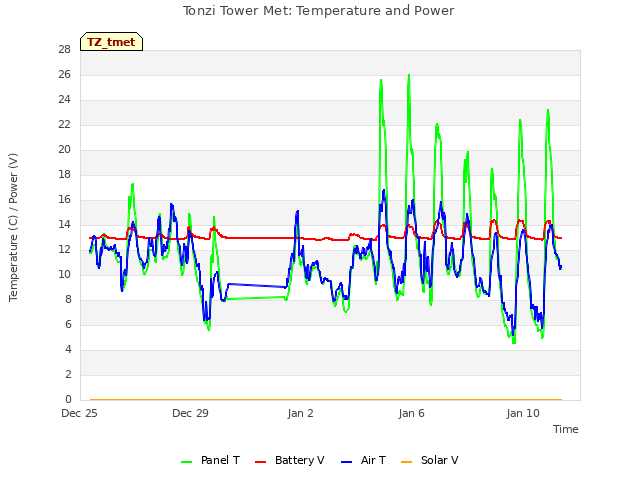
- Panel and Batteries: 13.4 v; 0.0 amps; 5.4 amps.
- Reading from Gillsonic screen
before downloading data. (The value
of H2O and CO2 should be in the range of 0 – 5 v.)
Time
|
11:49:40
|
Path/File name
|
D:\Data\T06_010.flx
D:\Data\T060101130.raw
|
|
mean
|
std
|
|
mean
|
std
|
w
|
0.01
|
0.472
|
Ts
|
15.3
|
0.349
|
u
|
-0.03
|
0.395
|
H2O
|
0.005
|
0.004
|
v
|
1.42
|
0.237
|
CO2
|
0.001
|
0.004
|
- Li-7500’s readings were too low.
Matthias and I reset power, but no use. Later on, Ted found there was bird crap
on the sensor and fixed the problem.
- Rain Gage was full of water. Need to be fixed.
- downloading data
- check the fans of air temp.
and relative humidity sensors on the tower and the floor. Good!
- Check calibration cylinders: Maybe it is time to replace tanks!!
CO 2 <100 psig; flow normal
psi.
N 2 500
psig; flow normal psi.
Is the pump running Yes.
- close gate and set up fence.
Toniz_Floor
Site
- Fence and gate power: >12 v.
- Panel and Batteries: 13.5 v; 18.8 amps; 2.7 amps.
- Reading from Gillsonic screen
before downloading data. (The value
of H2O and CO2 should be in the range of 0 – 5 v.)
Time
|
12:03:26
|
Path/File name
|
D:\Data\F06_010.flx
D:\Data\FL060101202.raw
|
|
mean
|
std
|
|
mean
|
std
|
w
|
0.04
|
0.209
|
Ts
|
19.1
|
1.970
|
u
|
-1.80
|
2.65
|
H2O
|
2.091
|
0.234
|
v
|
-0.06
|
0.934
|
CO2
|
2.192
|
0.170
|
- downloading data
- Screen wasn’t connected with
PC when I got there. PC seemed to
be on at the time. CD drive may cause the problem. Later on, talk to Ted. He said it is possible that running CD
drove too much current. Sometimes
the current is not good enough to do the job and then cause the restart
failed.
- Soil CO2 profile
Reading
from datalogger
Panel
temp
|
19.9
|
|
|
Battery
voltage
|
13.9
|
|
|
CO2E_1
|
2349.1
|
TCE_1
|
14.27
|
CO2W_1
|
1101.0
|
TCW_1
|
16.6
|
CO2E_2
|
1175.3
|
TCE_2
|
17.26
|
CO2W_2
|
1378.9
|
TCW_2
|
13.6
|
CO2E_3
|
1479.1
|
TCE_3
|
12.59
|
CO2W_3
|
4642.7
|
TCW_3
|
12.9
|
CO2E_4
|
3025.4
|
TCE_4
|
9.92
|
CO2W_4
|
5183.5
|
TCW_4
|
12.9
|
Reading
from panels of analyzers
depth
|
Open
|
order
|
depth
|
Tree
|
order
|
2cm
(1%)
|
4760
|
1
|
2cm
(1%)
|
2230
|
1
|
4cm
|
2390
|
2
|
4cm
|
1.04%
|
4
|
8cm
|
2960
|
3
|
8cm
|
2800
|
2
|
16cm
|
6140
|
4
|
16cm
|
1.81%
|
3
|
- Close gate and set up fence.
Tonzi
|
|
|
|
Dendrometer
|
|
|
|
|
|
|
Date
|
Day
|
Tag #
|
Reading (cm)
|
1/10/2006
|
10
|
71
|
22.7
|
|
|
72
|
23.3
|
|
|
77
|
Broken
|
|
|
78
|
Broken
|
|
|
79
|
23
|
|
|
245
|
20.4
|
|
|
248
|
24.3
|
|
|
250
|
21.9
|
|
|
255
|
23.9
|
|
|
252
|
missing
|
|
|
102
|
Broken
|
tonzi
|
7931AFE
|
402165
|
574B4B
|
402FF3
|
574632
|
7A432E
|
7A3C6E
|
7A3B40
|
7A4AAA
|
D010
|
|
|
|
|
|
|
|
|
|
10-Jan-06
|
SM
|
|
|
|
|
|
|
|
|
0-15
|
40.3
|
35.5
|
43.1
|
20.9
|
39.8
|
30.2
|
23.9
|
24.9
|
22.0
|
15-30
|
38.3
|
41.7
|
34.3
|
40.0
|
37.1
|
28.7
|
28.6
|
33.0
|
20.4
|
30-45
|
37.2
|
41.6
|
40.7
|
36.7
|
42.9
|
33.1
|
33.1
|
31.8
|
34.5
|
45-60
|
38.7
|
53.8
|
50.4
|
42.1
|
40.7
|
33.1
|
43.7
|
44.1
|
35.6
|
|
|
|
|
|
|
|
|
|
|
|
A6D882B
|
A3D04E8
|
A6D72F5
|
|
|
|
|
|
|
|
|
|
|
|
|
|
|
|
|
0-15
|
33.3
|
30.8
|
19.6
|
|
|
|
|
|
|
15-30
|
28.8
|
30.3
|
33.2
|
|
|
|
|
|
|
30-45
|
35.5
|
34.8
|
35.9
|
|
|
|
|
|
|
45-60
|
41.8
|
47.2
|
44.8
|
|
|
|
|
|
|
|
|
|
|
|
|
|
|
|
|
vaira
|
57318a
|
7933dee
|
|
|
|
|
|
|
|
0-15
|
19.0
|
25.6
|
|
|
|
|
|
|
|
15-30
|
27.2
|
36.5
|
|
|
|
|
|
|
|
30-45
|
30.1
|
34.2
|
|
|
|
|
|
|
|
45-60
|
31.7
|
33.9
|
|
|
|
|
|
|
|
Sample vial
|
What
|
MIBA-US-01._-
|
Leave 1
|
MIBA-US-01.__-
|
Leave 2
|
MIBA-US-01. ___137_
|
Grass 1
|
MIBA-US-01. __138
|
Grass 2
|
MIBA-US-01. _139
|
Surface Litter
|
MIBA-US-01. _140_
|
Soil in 10 cm
|
MIBA-US-01. _141__
|
Stem 1
|
MIBA-US-01. _142_
|
Stem 2
|
|
Field Data
No tank data
No TZ Well data found
No TZ Moisture Point data found
No VR Moisture Point data found
No TZ grass heigth found
No VR grass heigth found
No TZ Tree DBH found
No water potential data found
No TZ Grass Biomass data found
No TZ OakLeaves Biomass data found
No TZ PineNeedles Biomass data found
0 photos found
16 sets found
No data found for TZ_Fenergy.
11 TZ_tmet graphs found


No data found for TZ_soilco2.
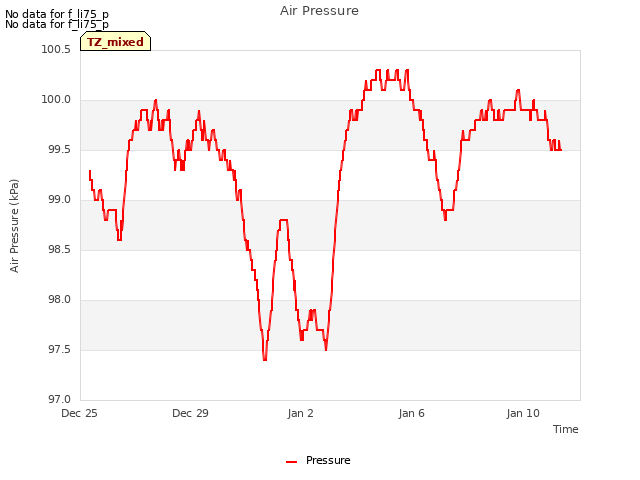
Can't check TZ_mixed
3 TZ_mixed graphs found

No data found for TZ_fflux.
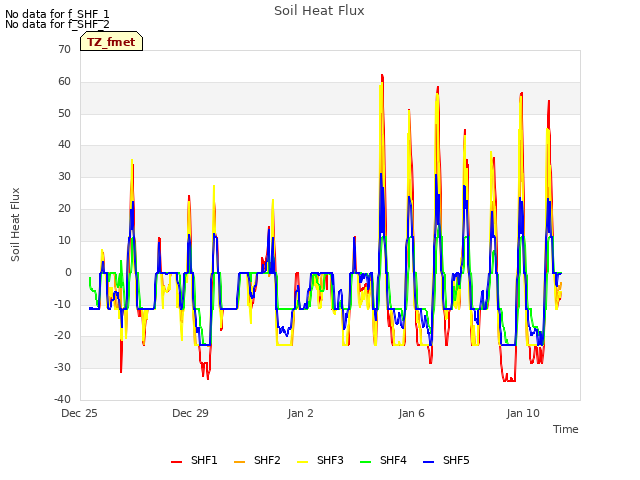
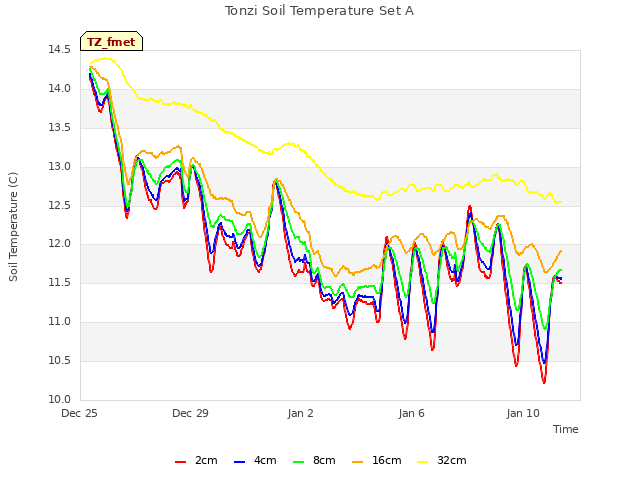
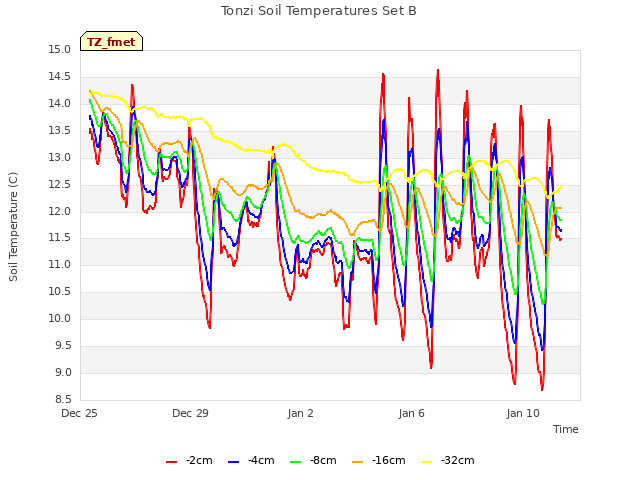
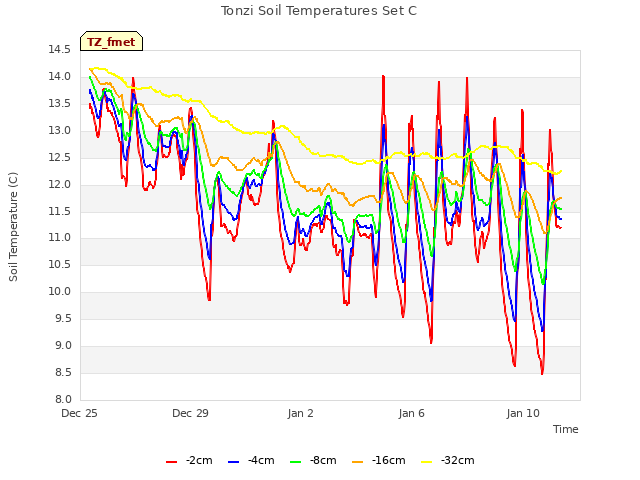
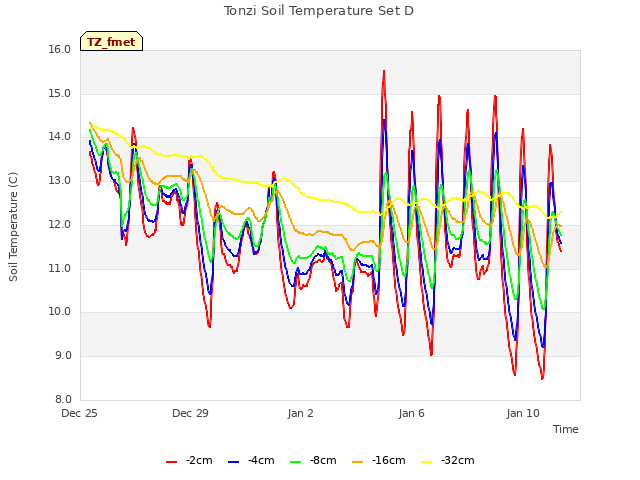
8 TZ_fmet graphs found


No data found for TZ_tram.
No data found for TZ_co2prof.
No data found for TZ_irt.
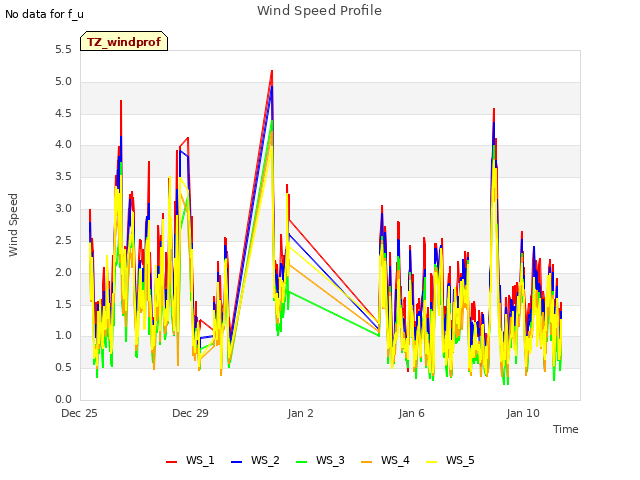
1 TZ_windprof graphs found
No data found for TZ_tflux.
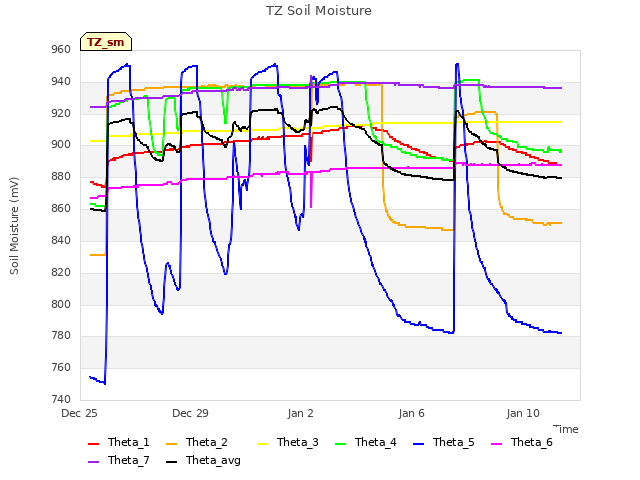
2 TZ_sm graphs found
Can't check TZ_met
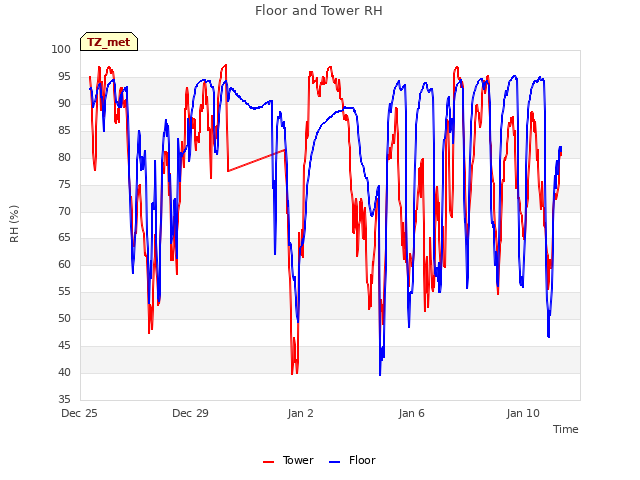
1 TZ_met graphs found
Can't check TZVR_mixed
No data found for TZ_osu.
No data found for TZ_fd.
Tonzi Z-cam data


