
Field Notes
<--2017-04-05 10:30:00 | 2017-04-10 12:00:00-->Other sites visited today: Tonzi | Vaira
Phenocam link: Searching...
Tonzi: 2017-04-05 12:00:00 (DOY 95)
Author: Joe Verfaillie
Others: Siyan
Summary: Fixed data logger clocks, swapped LED sensor, Tower computer died.
| Tonzi 2017-04-05 I arrived about 12:00 with Siyan. I was sunny and warm. Everything is very green but the trees are not as fully leafed out here as at Vaira. There is no standing water in the road. The Tower computer clock and most of the data loggers are one day ahead. This resulted from resetting the clocks last time. A combination of resetting to DST, then 12 hours ahead due to AM/PM confusion, then having the day advance before finally setting the time back 12 hours, but not fixing the day. At 11:02 I changed the date from 04/06 to 04/05. This affected tz6_tmet, tz5_sm and fmet, tt_CR1000, tf_CR1000. I collected all the soil CO2 data manually with the laptop because I missed some of it last time. I removed Yourgryel’s LED sensor (sn RYU-01) and replaced it with one of ours. His had eight channels ( including blue and green) but ours only has four. I did not change the program so four of the channels are garbage. The hoisting rope had been chewed (maybe by rats) near the hook end. I cut off about 10ft and reattached the hook. Just before leaving the Tower computer blew up. It got almost too hot to touch. I pulled it out and let it cool down then tried plugging it back in. Nothing. I brought it in. The only things that will not get recorded are the camera images. Siyan did midday water potential. The Global Water well logger’s cable is crumbling. |
Veg Height (cm): Tape measure from ground to top of plant
24, 20, 17, 20, 18, 20, 27, 18, 17, 16, 15, 9, 14, 13, 20, avg = 17.9, stdev = 4.39
Field Data
No tank data
Well Depth
| Date | Location | Depth (feet) |
|---|---|---|
| 2017-04-05 | TZ_floor | 10.3 |
| 2017-04-05 | TZ_road | 19.5 |
| 2017-04-05 | TZ_tower | 13.5 |
| 2017-04-05 | VR_pond | 21.88 |
mode = both
Moisture Point Probes TZ
Array
(
[0] => Tower_1
[1] => Floor_South_1
[2] => Floor_East_1
[3] => Floor_West_1
[4] => SoilCO2_1
[5] => Soil_Transect_4_1
[6] => Soil_Transect_3_1
[7] => Soil_Transect_2_1
[8] => Soil_Transect_1_1
[9] => SoilCO2_West_A_1
[10] => SoilCO2_West_B_1
[11] => SoilCO2_West_C_1
[12] => Tower_2
[13] => Floor_South_2
[14] => Floor_East_2
[15] => Floor_West_2
[16] => SoilCO2_2
[17] => Soil_Transect_4_2
[18] => Soil_Transect_3_2
[19] => Soil_Transect_2_2
[20] => Soil_Transect_1_2
[21] => SoilCO2_West_A_2
[22] => SoilCO2_West_B_2
[23] => SoilCO2_West_C_2
[24] => Tower_3
[25] => Floor_South_3
[26] => Floor_East_3
[27] => Floor_West_3
[28] => SoilCO2_3
[29] => Soil_Transect_4_3
[30] => Soil_Transect_3_3
[31] => Soil_Transect_2_3
[32] => Soil_Transect_1_3
[33] => SoilCO2_West_A_3
[34] => SoilCO2_West_B_3
[35] => SoilCO2_West_C_3
[36] => Tower_4
[37] => Floor_South_4
[38] => Floor_East_4
[39] => Floor_West_4
[40] => SoilCO2_4
[41] => Soil_Transect_4_4
[42] => Soil_Transect_3_4
[43] => Soil_Transect_2_4
[44] => Soil_Transect_1_4
[45] => SoilCO2_West_A_4
[46] => SoilCO2_West_B_4
[47] => SoilCO2_West_C_4
)
| Date | DOY | Rep | Depth | Tower_1 |
Floor_South_1 |
Floor_East_1 |
Floor_West_1 |
SoilCO2_1 |
Soil_Transect_4_1 |
Soil_Transect_3_1 |
Soil_Transect_2_1 |
Soil_Transect_1_1 |
SoilCO2_West_A_1 |
SoilCO2_West_B_1 |
SoilCO2_West_C_1 |
Tower_2 |
Floor_South_2 |
Floor_East_2 |
Floor_West_2 |
SoilCO2_2 |
Soil_Transect_4_2 |
Soil_Transect_3_2 |
Soil_Transect_2_2 |
Soil_Transect_1_2 |
SoilCO2_West_A_2 |
SoilCO2_West_B_2 |
SoilCO2_West_C_2 |
Tower_3 |
Floor_South_3 |
Floor_East_3 |
Floor_West_3 |
SoilCO2_3 |
Soil_Transect_4_3 |
Soil_Transect_3_3 |
Soil_Transect_2_3 |
Soil_Transect_1_3 |
SoilCO2_West_A_3 |
SoilCO2_West_B_3 |
SoilCO2_West_C_3 |
Tower_4 |
Floor_South_4 |
Floor_East_4 |
Floor_West_4 |
SoilCO2_4 |
Soil_Transect_4_4 |
Soil_Transect_3_4 |
Soil_Transect_2_4 |
Soil_Transect_1_4 |
SoilCO2_West_A_4 |
SoilCO2_West_B_4 |
SoilCO2_West_C_4 |
Avg | Spacial Count |
Measurement Count |
|---|---|---|---|---|---|---|---|---|---|---|---|---|---|---|---|---|---|---|---|---|---|---|---|---|---|---|---|---|---|---|---|---|---|---|---|---|---|---|---|---|---|---|---|---|---|---|---|---|---|---|---|---|---|---|
| 2017-04-05 | 95 | 0 | nan | 33.5 | 23.2 | 39.9 | 39 | 39.9 | 30.2 | 17.9 | 21.7 | 24.1 | 29.1 | 30.8 | 26.4 | 37.8 | 37.4 | 35.2 | 31.5 | 50 | 28.3 | 29.8 | 28.9 | 17.9 | 28.6 | 21.6 | 29.5 | 33.5 | 42.1 | 39.6 | 42.4 | 39.6 | 30.1 | 30.4 | 34.9 | 33.5 | 34.3 | 34.1 | 37.4 | 42.3 | 57.4 | 58.4 | 48 | 41.1 | 36 | 43.1 | 53.1 | 31.4 | 46.3 | 52.3 | 49.4 | |||
| 2017-04-05 | 95 | 1 | nan | 33.2 | 22.3 | 39.3 | 37 | 29.4 | 16.5 | 17.9 | 24.4 | 28.5 | 30.5 | 26.4 | 38.1 | 36.8 | 36.5 | 32.3 | 27.7 | 29.2 | 28.9 | 18.2 | 28.6 | 20 | 29.5 | 33.5 | 41.9 | 39.6 | 42.7 | 29.6 | 30.4 | 33.5 | 33.2 | 34.1 | 34.9 | 39.1 | 40.8 | 56.6 | 41.4 | 48.8 | 36 | 46.6 | 50 | 31.1 | 50.6 | 50.9 | 50 | |||||||
| 2017-04-05 | 95 | Avg | 0-15cm | 0 | 0 | |||||||||||||||||||||||||||||||||||||||||||||||||
| 2017-04-05 | 95 | Avg | 15-30cm | 0 | 0 | |||||||||||||||||||||||||||||||||||||||||||||||||
| 2017-04-05 | 95 | Avg | 30-45cm | 0 | 0 | |||||||||||||||||||||||||||||||||||||||||||||||||
| 2017-04-05 | 95 | Avg | 45-60cm | 0 | 0 |
mode = both
Moisture Point Probes VR
Array
(
[0] => Solar_Panels_1
[1] => Flux_Tower_1
[2] => Gate_1
[3] => Biomass_Cage_1
[4] => Solar_Panels_2
[5] => Flux_Tower_2
[6] => Gate_2
[7] => Biomass_Cage_2
[8] => Solar_Panels_3
[9] => Flux_Tower_3
[10] => Gate_3
[11] => Biomass_Cage_3
[12] => Solar_Panels_4
[13] => Flux_Tower_4
[14] => Gate_4
[15] => Biomass_Cage_4
)
| Date | DOY | Rep | Depth | Solar_Panels_1 |
Flux_Tower_1 |
Gate_1 |
Biomass_Cage_1 |
Solar_Panels_2 |
Flux_Tower_2 |
Gate_2 |
Biomass_Cage_2 |
Solar_Panels_3 |
Flux_Tower_3 |
Gate_3 |
Biomass_Cage_3 |
Solar_Panels_4 |
Flux_Tower_4 |
Gate_4 |
Biomass_Cage_4 |
Avg | Spacial Count |
Measurement Count |
|---|---|---|---|---|---|---|---|---|---|---|---|---|---|---|---|---|---|---|---|---|---|---|
| 2017-04-05 | 95 | 0 | nan | 16.8 | 18.2 | 16.5 | 6.5 | 24.6 | 25.8 | 20.3 | 17 | 27.1 | 13.4 | 24.6 | 26.2 | 40.5 | 25.9 | 21.6 | 28.5 | |||
| 2017-04-05 | 95 | 1 | nan | 16.8 | 18.2 | 18.8 | 6.5 | 24.3 | 26.7 | 20 | 16.7 | 27.1 | 13.4 | 25.1 | 27.6 | 40.3 | 26.5 | 21.3 | 28.8 | |||
| 2017-04-05 | 95 | Avg | 0-15cm | 0 | 0 | |||||||||||||||||
| 2017-04-05 | 95 | Avg | 15-30cm | 0 | 0 | |||||||||||||||||
| 2017-04-05 | 95 | Avg | 30-45cm | 0 | 0 | |||||||||||||||||
| 2017-04-05 | 95 | Avg | 45-60cm | 0 | 0 |
Grass Height TZ 15
| Date | Height reps (cm) | Location | Average | Samp | STDEV | ||||||||||||||
|---|---|---|---|---|---|---|---|---|---|---|---|---|---|---|---|---|---|---|---|
| 2017-04-05 | 24 | 20 | 17 | 20 | 18 | 20 | 27 | 18 | 17 | 16 | 15 | 9 | 14 | 13 | 20 | GH_ALL | 17.87 | 15 | 4.24 |
Grass Height VR 15
| Date | Height reps (cm) | Location | Average | Samp | STDEV | ||||||||||||||
|---|---|---|---|---|---|---|---|---|---|---|---|---|---|---|---|---|---|---|---|
| 2017-04-05 | 49 | 34 | 39 | 48 | 25 | 33 | 17 | 20 | 17 | 16 | 40 | 30 | 20 | 24 | 16 | GH_ALL | 28.53 | 15 | 11.1 |
Tree DBH
| Date | Tag# | Reading (mm) |
|---|---|---|
| 2017-04-05 | 1 | 25.5 |
| 2017-04-05 | 102 | 22.1 |
| 2017-04-05 | 2 | 20.1 |
| 2017-04-05 | 245 | 22.5 |
| 2017-04-05 | 3 | 19.0 |
| 2017-04-05 | 4 | 20.5 |
| 2017-04-05 | 5 | 21.2 |
| 2017-04-05 | 7 | 18.1 |
| 2017-04-05 | 72 | 23.6 |
| 2017-04-05 | 79 | 22.6 |
| 2017-04-05 | 8 | 21.2 |
Water Potential - mode: raw
| Time | Species | Tree | readings (bar) | |||||
|---|---|---|---|---|---|---|---|---|
| 2017-04-05 13:10:00 | OAK | 102 | -8 | -4 | -10 | |||
| 2017-04-05 13:10:00 | OAK | 35 | -10 | -14 | -12 | |||
| 2017-04-05 13:10:00 | OAK | 92 | -10 | -7 | -12 | |||
| 2017-04-05 13:30:00 | PINE | OLD | -1 | -15 | -6 | -1 | -1 | -24 |
No TZ Grass Biomass data found
No TZ OakLeaves Biomass data found
No TZ PineNeedles Biomass data found
1 photos found
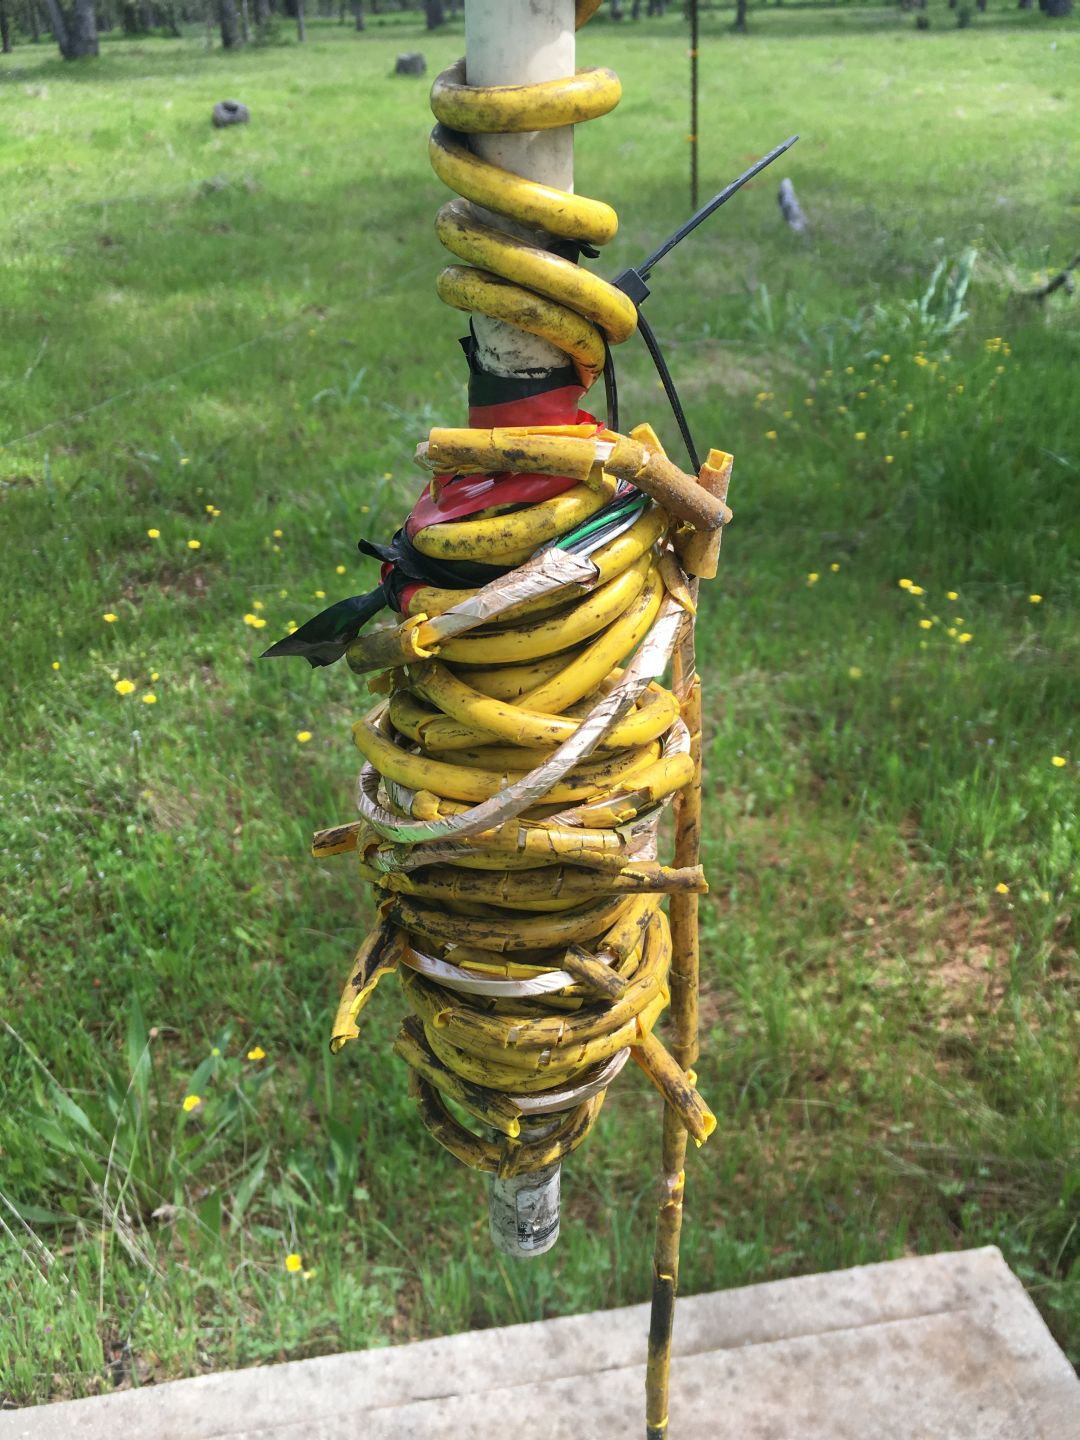
20170405TZ_WellCableRotting.jpg ( 2017-04-05 12:26:32 ) Full size: 1080x1440
Well cable is rotting
16 sets found
No data found for TZ_Fenergy.
11 TZ_tmet graphs found
11 TZ_soilco2 graphs found
Can't check TZ_mixed
3 TZ_mixed graphs found
1 TZ_fflux graphs found
8 TZ_fmet graphs found
No data found for TZ_tram.
No data found for TZ_co2prof.
1 TZ_irt graphs found
No data found for TZ_windprof.
1 TZ_tflux graphs found
2 TZ_sm graphs found
Can't check TZ_met
1 TZ_met graphs found
Can't check TZVR_mixed
No data found for TZ_osu.
No data found for TZ_fd.
Tonzi Z-cam data