Field Notes
<--2007-06-06 08:00:00 |
2007-06-27 00:00:00-->
Phenocam link:
Searching...Tonzi: 2007-06-23 15:30:00 (DOY 174)
Author: Siyan Ma
Others: Youngryel
When: Date: 6/23/2007 , Day: 174
, Watch Time: 3:30pm .
Where: Tonzi/Vaira Ranch
Who: Siyan, Youngryel
Weather:
clear
Phenology:
yellow grass, green tree
Summary
- swap Li-7500 on Tower and
Floor
- Tower EC system worked
well. The screen showed “no
signal”. Have talked with Ted about
this. He recommended not restarting
computer. Click “shift” once, then
the screen will work fine.
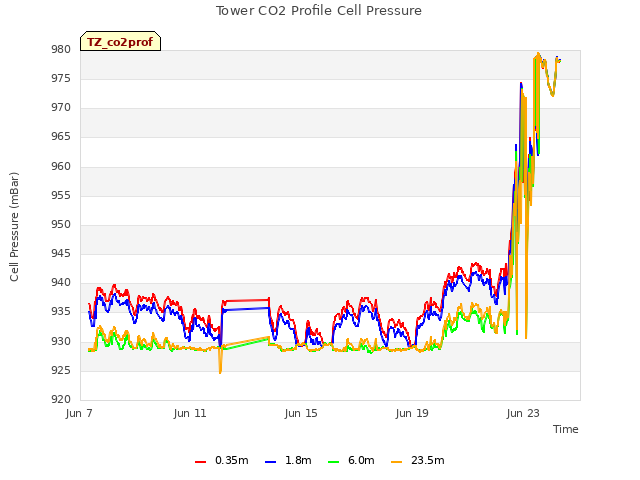
- The pump of CO2 profile
failed. Notice Ted already.
- correct PC and datalogger
time with Cell Phone at floor sites, about 1 minute off.
- soil moisture and dendrometer
measurement. Done.
- Help Youngryel sending 1hz
tram program into the datalogger.
- Help Youngryel take tree LAI
measurement using LAI-2000 with two sets of sensors. Did two-sensor comparison before and
after sunset. One set was placed on
the top of tower, and the other was hold by Youngryel to do understory
measurement (↑↓↓↓↓). I manually clicked the
tower set to match the same pattern (↑↑↑↑↑).
We try to know: (1) using 180o mask won’t be different from
none mask; (2) reference taken in the open area is not different from that
taken on the top of tower.
Youngryel took point measurement at each bar of tram station,
repeating twice.
Vaira_Grass
Site
- Fence and gate power: 12
v.
- Panel and Batteries: 13.4 v; 8.9 amps; 2.0 amps.
- Reading from Gillsonic screen
before downloading data. (The value
of H2O and CO2 should be in the range of 0 – 5 v.)
Time
|
|
Path/File name
|
D:\Data\V07_ 174
.flx
D:\Data\VR07 .raw
|
|
mean
|
std
|
|
mean
|
std
|
w
|
-0.02
|
0.416
|
Ts
|
32.12
|
1.597
|
u
|
-2.27
|
0.969
|
H2O
|
1.221
|
0.021
|
v
|
2.7
|
0.054
|
CO2
|
1.269
|
0.027
|
|
|
|
Tc
|
3.054
|
0.129
|
- didn’t download data (forget
where is the memory card.)
- check the fans of air temp.
and relative humidity sensors at Vaira. Good.
- Check MD-9 system connections:
Good.
- Check levels of Radiation
sensors, clear up surfaces. Done!
- Closed gate and set up fence.
Yes.
Tonzi_Tower Site
- Fence and gate power: 12
v.
- Panel and Batteries: 13.4 v; 0.0 amps; 4.1 amps.
- Reading from Gillsonic screen
before downloading data. (The value
of H2O and CO2 should be in the range of 0 – 5 v.)
Time
|
|
Path/File name
|
D:\Data\T07_ 174 .flx
D:\Data\TW07 .raw
|
|
mean
|
std
|
|
mean
|
std
|
w
|
0.42
|
0.99
|
Ts
|
28.36
|
1.22
|
u
|
3.77
|
0.92
|
H2O
|
1.57
|
0.06
|
v
|
3.16
|
1.36
|
CO2
|
1.47
|
0.1
|
- didn’t download data (forget
where is the memory card.)
- swaping Li-7500 Analyzer. (Remove SN# 976 ; install SN# 35 )
- check the fans of air temp.
and relative humidity sensors on the tower and the floor.
- Check calibration cylinders;
CO 2 1100 psig; flow 20
psi.
N 2 800
psig; flow 20 psi. (It may be low!)
Manually calibrate Li-800. Following Ted’s instruction: H:\IoneSavanna_2004\Tower_2004\CO2Profile\LI800_Calibration_Procedure_2Nov04.txt
Is the pump running No!!!!
(Ted visited Tonzi today (Jun. 26, 2007).)
How to check the CO2 values
Click “Ports/Flags” button to see which ports or flags is setting
high. Pressure should be less than
ambient value. When Flag 8 is high, it
may indicate that RRR’s battery is low.
- close gate and set up fence. Yes.
Toniz_Floor
Site
- Fence and gate power: 12
v.
- Panel and Batteries: 12.8 v; 1.5 amps; 2.1 amps.
- Reading from Gillsonic screen
before downloading data. (The value
of H2O and CO2 should be in the range of 0 – 5 v.)
Time
|
|
Path/File name
|
D:\Data\F07_
174 .flx
D:\Data\FL07 .raw
|
|
mean
|
std
|
|
mean
|
std
|
w
|
-0.21
|
0.29
|
Ts
|
31.7
|
0.71
|
u
|
-0.81
|
1.37
|
H2O
|
1.193
|
0.02
|
v
|
-0.25
|
0.94
|
CO2
|
1.460
|
0.01
|
- didn’t download data (forget
where is the memory card.)
- swaping Li-7500
Analyzer. (Remove SN# 73 ; install SN# 65 )
- Check MD-9 system connections. All Good.
- Soil CO2 profile
Reading
from datalogger
Panel
temp
|
38.6
|
|
|
Battery
voltage
|
12.4
|
|
|
CO2E_1
|
237
|
TCE_1
|
46
|
CO2W_1
|
449
|
TCW_1
|
36
|
CO2E_2
|
287
|
TCE_2
|
47
|
CO2W_2
|
539
|
TCW_2
|
31
|
CO2E_3
|
459
|
TCE_3
|
41
|
CO2W_3
|
1192
|
TCW_3
|
24
|
CO2E_4
|
559
|
TCE_4
|
33
|
CO2W_4
|
1450
|
TCW_4
|
27
|
Reading
from panels of analyzers
depth
|
Open
|
order
|
depth
|
Tree
|
order
|
2cm
(1%)
|
500
|
1
|
2cm
(1%)
|
990
|
1
|
4cm
|
580
|
2
|
4cm
|
2890
|
4
|
8cm
|
870
|
3
|
8cm
|
1180
|
2
|
16cm
|
1140
|
4
|
16cm
|
0.49%
|
3
|
- Close gate and set up fence. Yes.
Tonzi
|
|
|
|
Dendrometer
|
|
|
|
|
|
|
Date
|
Day
|
Tag #
|
Reading (cm)
|
6/23/2007
|
174
|
71
|
24.6
|
|
|
72
|
23.5
|
|
|
77
|
Broken
|
|
|
78
|
Broken
|
|
|
79
|
23.5
|
|
|
245
|
22.8
|
|
|
248
|
24.6
|
|
|
250
|
22.0
|
|
|
255
|
broken
|
|
|
252
|
missing
|
|
|
102
|
Broken
|
tonzi
|
7931AFE
|
402165
|
574B4B
|
402FF3
|
574632
|
7A432E
|
7A3C6E
|
7A3B40
|
7A4AAA
|
23-Jun-07
|
174
|
|
|
|
|
|
|
|
|
|
SM
|
|
|
|
|
|
|
|
|
0-15
|
9.7
|
4.7
|
14.4
|
6.7
|
12.3
|
5.9
|
7.0
|
4.5
|
3.0
|
15-30
|
13.6
|
13.3
|
13.0
|
13.9
|
10.5
|
7.1
|
10.9
|
11.4
|
2.5
|
30-45
|
19.3
|
8.4
|
9.8
|
15.8
|
3.8
|
10.6
|
11.3
|
15.4
|
12.9
|
45-60
|
15.3
|
4.3
|
9.6
|
14.4
|
12.2
|
11.0
|
14.2
|
21.2
|
10.6
|
|
|
|
|
|
|
|
|
|
|
|
A6D882B
|
A3D04E8
|
A6D72F5
|
|
|
|
|
|
|
|
|
|
|
|
|
|
|
|
|
0-15
|
10.0
|
6.7
|
2.7
|
|
|
|
|
|
|
15-30
|
6.8
|
6.9
|
11.1
|
|
|
|
|
|
|
30-45
|
15.4
|
18.2
|
11.8
|
|
|
|
|
|
|
45-60
|
19.9
|
11.9
|
4.3
|
|
|
|
|
|
|
|
|
|
|
|
|
|
|
|
|
vaira
|
57318a
|
7933dee
|
|
|
|
|
|
|
|
0-15
|
1.9
|
0.7
|
|
|
|
|
|
|
|
15-30
|
5.0
|
7.8
|
|
|
|
|
|
|
|
30-45
|
8.4
|
11.4
|
|
|
|
|
|
|
|
45-60
|
15.5
|
16.1
|
|
|
|
|
|
|
|
|
Field Data
No tank data
No TZ Well data found
No TZ Moisture Point data found
No VR Moisture Point data found
No TZ grass heigth found
No VR grass heigth found
No TZ Tree DBH found
No water potential data found
No TZ Grass Biomass data found
No TZ OakLeaves Biomass data found
No TZ PineNeedles Biomass data found
0 photos found
16 sets found
No data found for TZ_Fenergy.
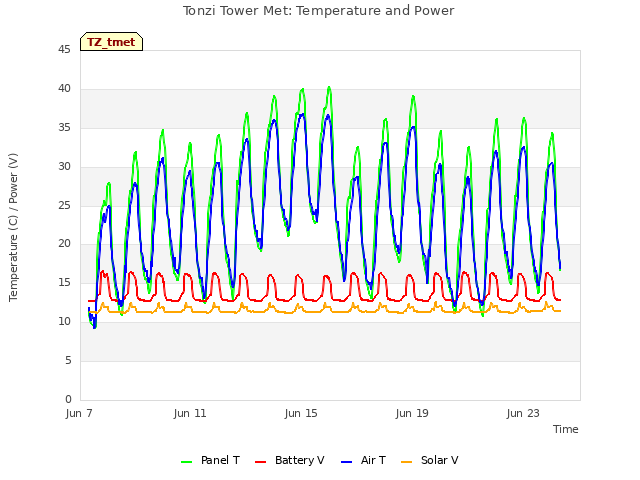
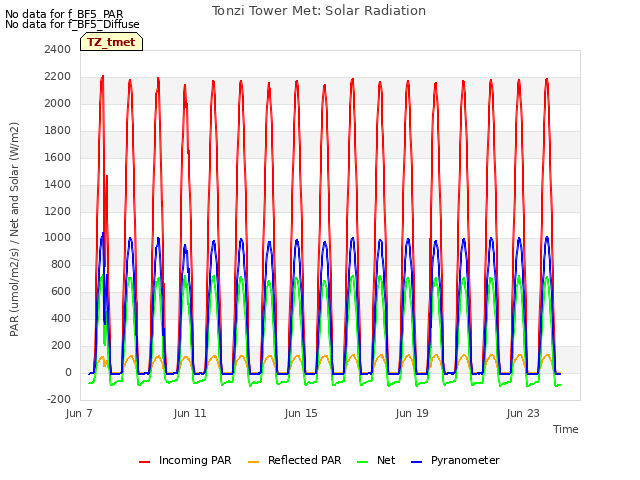
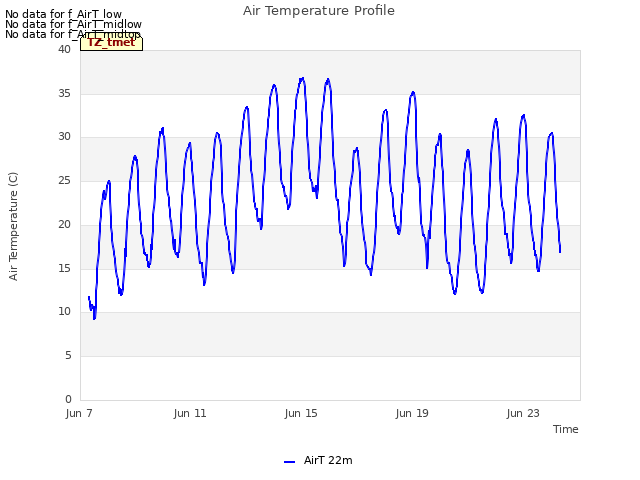
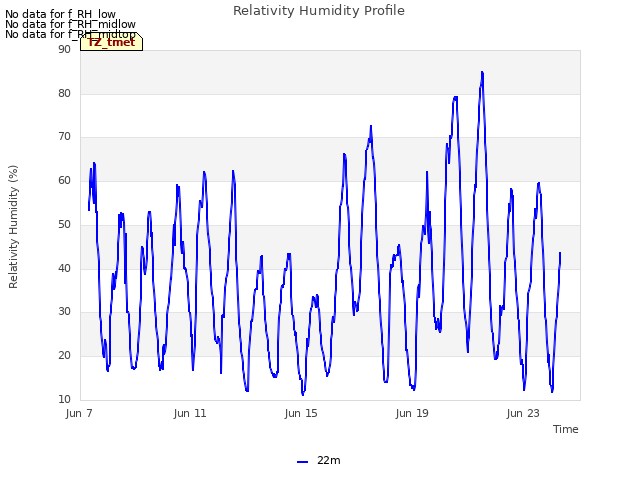
11 TZ_tmet graphs found


No data found for TZ_soilco2.
Can't check TZ_mixed
3 TZ_mixed graphs found

No data found for TZ_fflux.
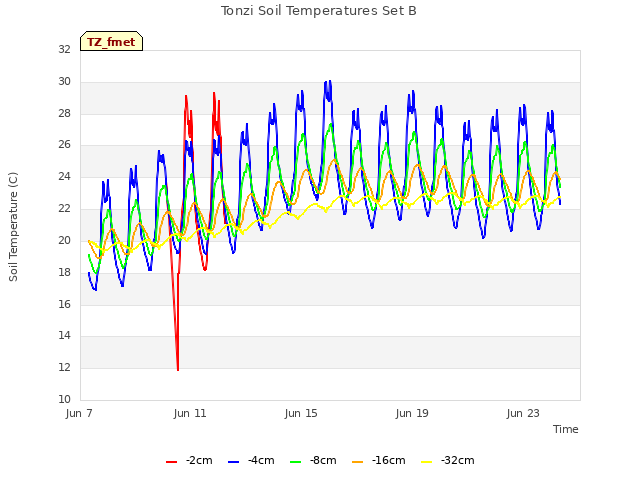
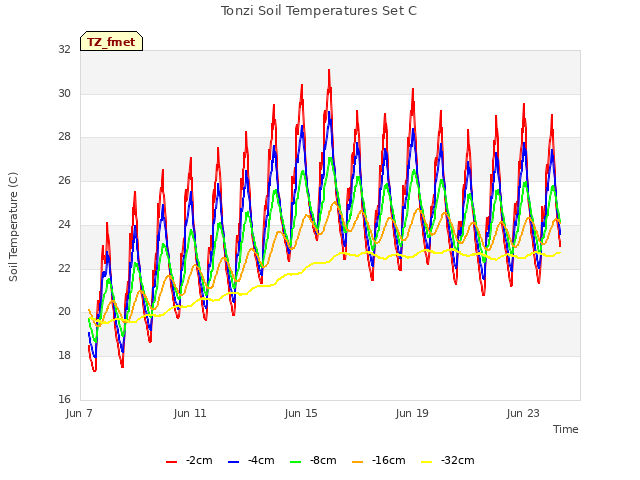
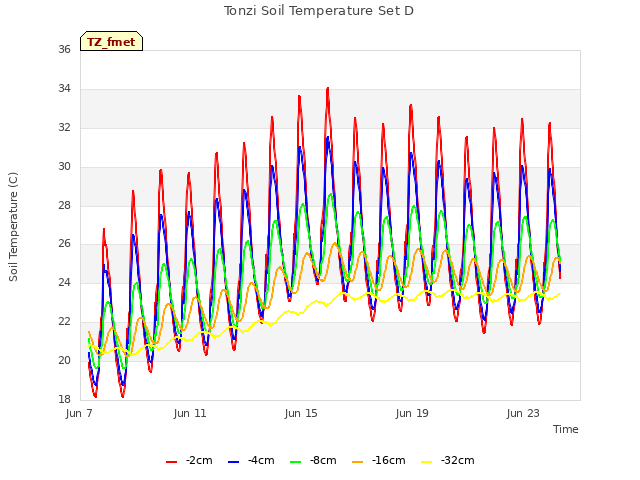
8 TZ_fmet graphs found


No data found for TZ_tram.
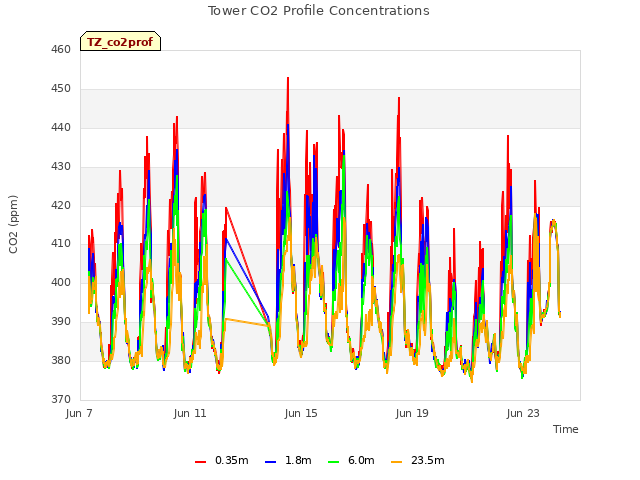
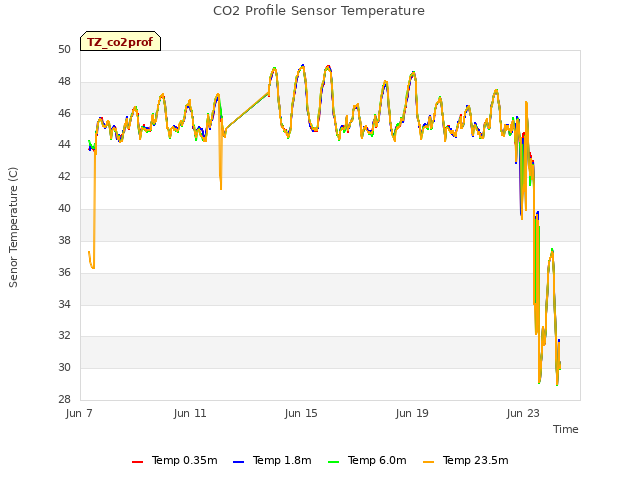
3 TZ_co2prof graphs found
No data found for TZ_irt.
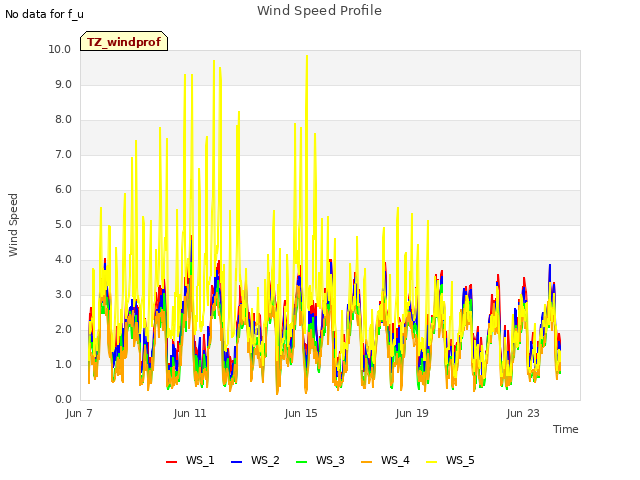
1 TZ_windprof graphs found
No data found for TZ_tflux.
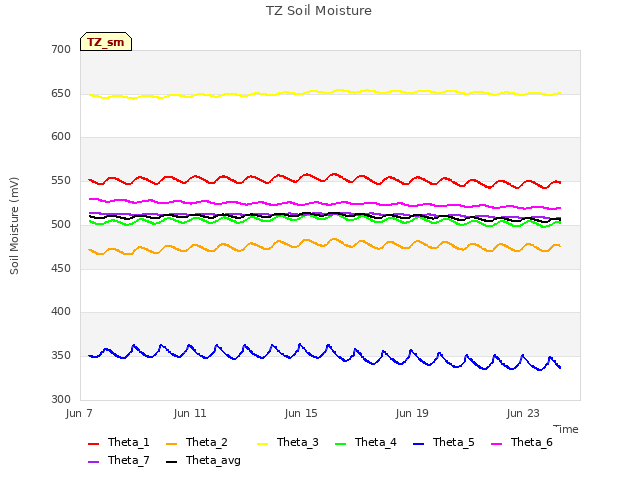
2 TZ_sm graphs found

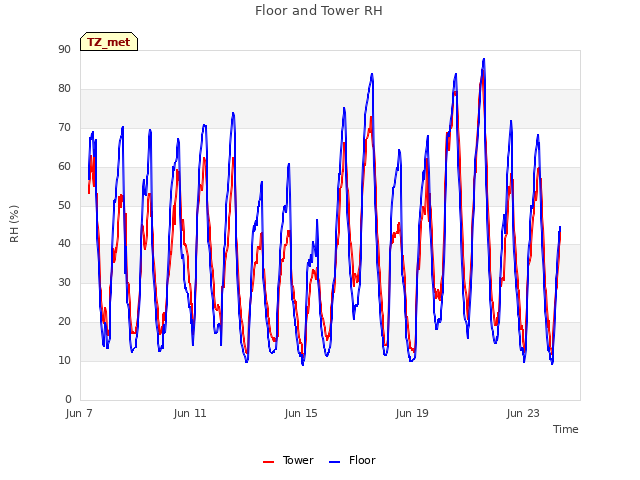
Can't check TZ_met
1 TZ_met graphs found
Can't check TZVR_mixed
No data found for TZ_osu.
No data found for TZ_fd.
Tonzi Z-cam data


