Field Notes
<--2007-05-25 11:00:00 |
2007-06-06 08:00:00-->
Phenocam link:
Searching...Tonzi: 2007-05-31 10:00:00 (DOY 151)
Author: Siyan Ma
Others: Dennis, Jessica
When: Date: 5/31/2007 , Day: 151
, Watch Time: 10:00 .
Where: Tonzi/Vaira Ranch
Who: Siyan, DDB, and Jessica
Weather:
clear, nice breeze, moist
Phenology:
yellow grass, grass died out. Green oak leaves with slight blue. Mr. Tonzi still worked on the new-cut
tree. He said the tree probably 3,000
years old because other ~100 years old tree is much smaller than it. Dennis think he may not be right, probably
~300 years old.
Summary
- swap Li-7500 on Vaira.
- EC system at Vaira and Floor
worked well. Data were downloaded.
- Tower computer was stuck
after I clicked the minimize button of flux window. After I restarted it, it started to
reboot itself automatically every 3 minutes. Dennis couldn’t fix it in the field; we
took the computer back to the lab.
- Dennis worked on the computer
this morning, and Tower flux and three-datalogger data were downloaded,
but data from data-loggers: CR10_10, CR9, and CR10X7 were not renamed day
by day. Ted, could you please take care of this. Thank you.
- Dennis notes: (1) Ted,
please bring in Fence/ground Rod at Vaira, around Hank generator
area. (2) on May 24, Ted has new
DLD on Vaira CR23X, but numeric output shows, repeat of Tc soil in 2
columns, no output of NDVI. Column
out of file. It is just the DLD
Assoc file as *.23x seem OK. (3) Lots of clovers. Good for N
- CR10X12 – Xingyuan’s sap flow
– disconnected to Floor computer!!!
- grass sample for ANPP at
Tonzi and Vaira
- oak leaf and branches for N
and area
- read dendrometer
- take spectrometer measurement
(Youngryle in Korea)
- the wheels of the cart need
pump in air.
Vaira_Grass
Site
- Fence and gate power: >12 v.
- Panel and Batteries: 13.7 v; 12.2 amps; 2.0 amps.
- Reading from Gillsonic screen
before downloading data. (The value
of H2O and CO2 should be in the range of 0 – 5 v.)
Time
|
|
Path/File name
|
D:\Data\V07_ 151
.flx
D:\Data\VR07 .raw
|
|
mean
|
std
|
|
mean
|
std
|
w
|
0.01
|
0.306
|
Ts
|
19.4
|
1.456
|
u
|
0.35
|
0.771
|
H2O
|
3.41
|
0.012
|
v
|
1.00
|
0.24
|
CO2
|
1.62
|
0.02
|
|
|
|
Tc
|
2.0
|
0.15
|
- downloading data OK
- swaping Li-7500
Analyzer. (Remove SN# 65 ; install SN# 41 )
- check the fans of air temp.
and relative humidity sensors at Vaira.
OK
- Check MD-9 system connections OK
- Check levels of Radiation sensors,
clear up surfaces. Done!
- Closed gate and set up fence. Yes.
Tonzi_Tower Site
- Fence and gate power: 12
v.
- Panel and Batteries: 13.7 v; 12.2 amps; 2.0 amps.
- Reading from Gillsonic screen
before downloading data. (The value
of H2O and CO2 should be in the range of 0 – 5 v.)
Time
|
12:03 (computer time Definitely watch time.)
|
Path/File name
|
D:\Data\T07_151 .flx
D:\Data\TW07 .raw
|
|
mean
|
std
|
|
mean
|
std
|
w
|
-0.04
|
|
Ts
|
20.0
|
|
u
|
1.4
|
|
H2O
|
2.89
|
|
v
|
0.98
|
|
CO2
|
1.707
|
|
- couldn’t download data because
the computer restart itself every 3 minutes. Tower computer was stuck
after I clicked the minimize button of flux window. After I restarted it, it started to
reboot itself automatically every 3 minutes. Dennis couldn’t fix it in the field; we
took the computer back to the lab.
- check the fans of air temp.
and relative humidity sensors on the tower and the floor. OK
- Check calibration cylinders;
CO 2 1100 psig; flow 18
psi.
N 2 850
psig; flow 20 psi.
Manually calibrate Li-800. Following Ted’s instruction: H:\IoneSavanna_2004\Tower_2004\CO2Profile\LI800_Calibration_Procedure_2Nov04.txt
Is the pump running
How to check the CO2 values
Click “Ports/Flags” button to see which ports or flags is setting
high. Pressure should be less than
ambient value. When Flag 8 is high, it
may indicate that RRR’s battery is low.
- Dennis disconnected CO2
profile system.
- close gate and set up fence.
Yes.
Toniz_Floor
Site
- Fence and gate power: 12
v.
- Panel and Batteries: 13.6 v; 8.5 amps; 2.0 amps.
- Reading from Gillsonic screen
before downloading data. (The value
of H2O and CO2 should be in the range of 0 – 5 v.)
Time
|
|
Path/File name
|
D:\Data\F07_
151 .flx
D:\Data\FL07 .raw
|
|
mean
|
std
|
|
mean
|
std
|
w
|
0.27
|
0.333
|
Ts
|
21.0
|
0.704
|
u
|
-0.11
|
1.400
|
H2O
|
2.551
|
0.025
|
v
|
0.8
|
0.941
|
CO2
|
1.014
|
0.014
|
- downloading data
- Check MD-9 system connections
CR23X3 – floor-Met
CR23X5 – soil CO 2
profile
CR23X6 – tower-Met
CR10X2 – floor-Met
CR10X4 – sap-flow
CR10X7 – CO 2 profile
CR10X8 – wind profile
CR10X12 – Xingyuan’s sap flow –
disconnected!!!
- Soil CO2 profile
Reading
from datalogger
Panel
temp
|
30.7
|
|
|
Battery
voltage
|
12.965
|
|
|
CO2E_1
|
315
|
TCE_1
|
38
|
CO2W_1
|
661
|
TCW_1
|
23
|
CO2E_2
|
362
|
TCE_2
|
40
|
CO2W_2
|
1662
|
TCW_2
|
21
|
CO2E_3
|
523
|
TCE_3
|
29
|
CO2W_3
|
2534
|
TCW_3
|
19
|
CO2E_4
|
816
|
TCE_4
|
26
|
CO2W_4
|
2361
|
TCW_4
|
20
|
Reading
from panels of analyzers
depth
|
Open
|
order
|
depth
|
Tree
|
order
|
2cm
(1%)
|
640
|
1
|
2cm
(1%)
|
1080
|
1
|
4cm
|
750
|
2
|
4cm
|
4710
|
4
|
8cm
|
1060
|
3
|
8cm
|
1330
|
2
|
16cm
|
1660
|
4
|
16cm
|
0.6%
|
3
|
- Close gate and set up fence.
31-May-07
|
151
|
|
|
|
|
|
|
|
|
|
SM
|
|
|
|
|
|
|
|
|
0-15
|
8.2
|
5.4
|
16.3
|
5.5
|
#DIV/0!
|
7.0
|
8.6
|
4.6
|
4.6
|
15-30
|
15.0
|
14.0
|
12.7
|
14.1
|
#DIV/0!
|
7.9
|
14.0
|
12.3
|
4.2
|
30-45
|
20.0
|
11.1
|
11.8
|
16.7
|
#DIV/0!
|
11.7
|
14.6
|
18.9
|
15.6
|
45-60
|
16.9
|
6.6
|
9.8
|
16.9
|
#DIV/0!
|
12.7
|
14.8
|
23.4
|
12.1
|
|
|
|
|
|
|
|
|
|
|
|
A6D882B
|
A3D04E8
|
A6D72F5
|
|
|
|
|
|
|
|
|
|
|
|
|
|
|
|
|
0-15
|
12.7
|
10.7
|
3.5
|
|
|
|
|
|
|
15-30
|
9.1
|
8.9
|
12.8
|
|
|
|
|
|
|
30-45
|
18.3
|
20.8
|
14.5
|
|
|
|
|
|
|
45-60
|
21.3
|
16.8
|
6.8
|
|
|
|
|
|
|
|
|
|
|
|
|
|
|
|
|
vaira
|
57318a
|
7933dee
|
|
|
|
|
|
|
|
0-15
|
2.5
|
0.7
|
|
|
|
|
|
|
|
15-30
|
5.9
|
8.9
|
|
|
|
|
|
|
|
30-45
|
10.4
|
11.4
|
|
|
|
|
|
|
|
45-60
|
12.0
|
15.2
|
|
|
|
|
|
|
|
Tonzi
|
|
|
|
Dendrometer
|
|
|
|
|
|
|
Date
|
Day
|
Tag #
|
Reading (cm)
|
5/31/2007
|
151
|
71
|
24.7
|
|
|
72
|
23.6
|
|
|
77
|
Broken
|
|
|
78
|
Broken
|
|
|
79
|
23.4
|
|
|
245
|
22.7
|
|
|
248
|
24.9
|
|
|
250
|
21.9
|
|
|
255
|
20.1
|
|
|
252
|
missing
|
|
|
102
|
Broken
|
|
Field Data
No tank data
No TZ Well data found
No TZ Moisture Point data found
No VR Moisture Point data found
No TZ grass heigth found
No VR grass heigth found
No TZ Tree DBH found
No water potential data found
No TZ Grass Biomass data found
No TZ OakLeaves Biomass data found
No TZ PineNeedles Biomass data found
0 photos found
16 sets found
No data found for TZ_Fenergy.
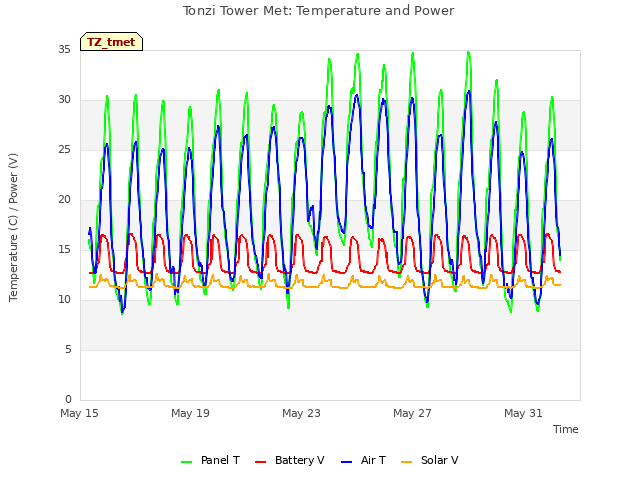
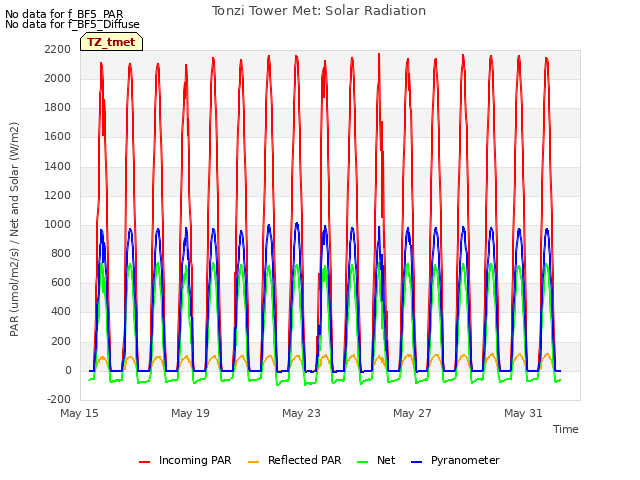
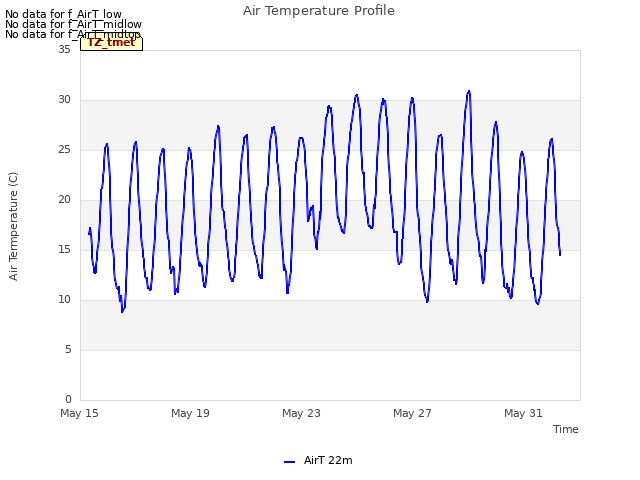
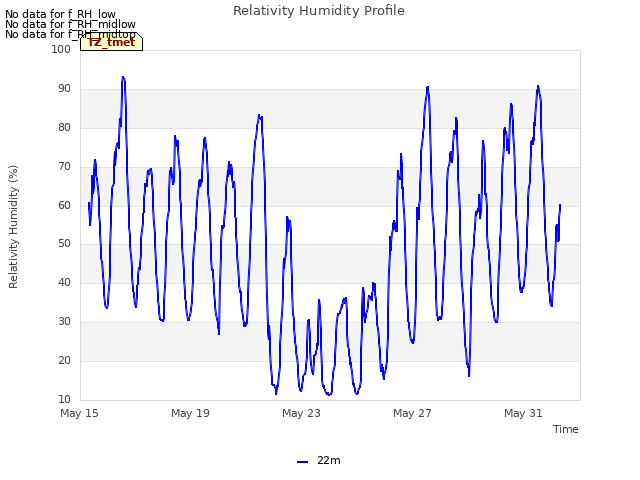
11 TZ_tmet graphs found


No data found for TZ_soilco2.
Can't check TZ_mixed
3 TZ_mixed graphs found

No data found for TZ_fflux.
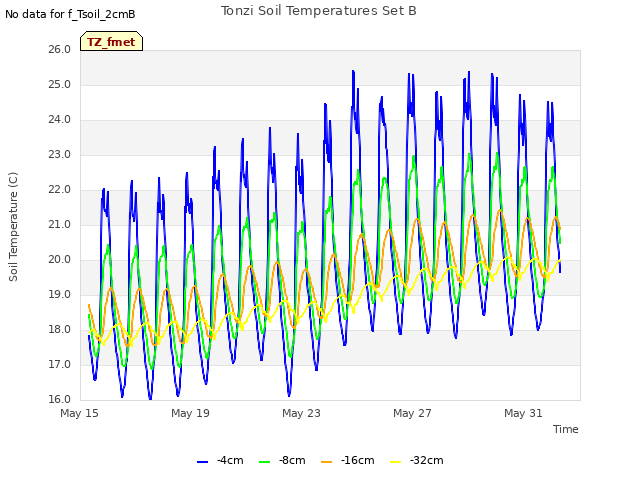
8 TZ_fmet graphs found


No data found for TZ_tram.
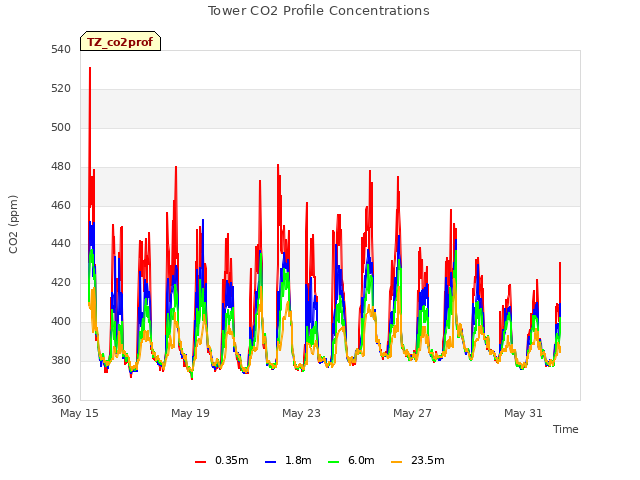
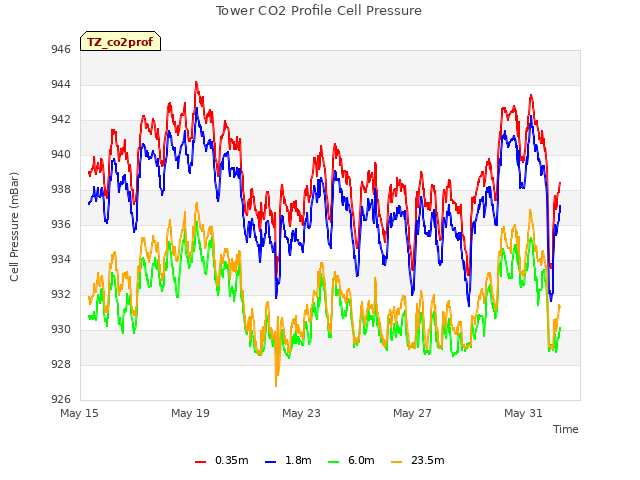
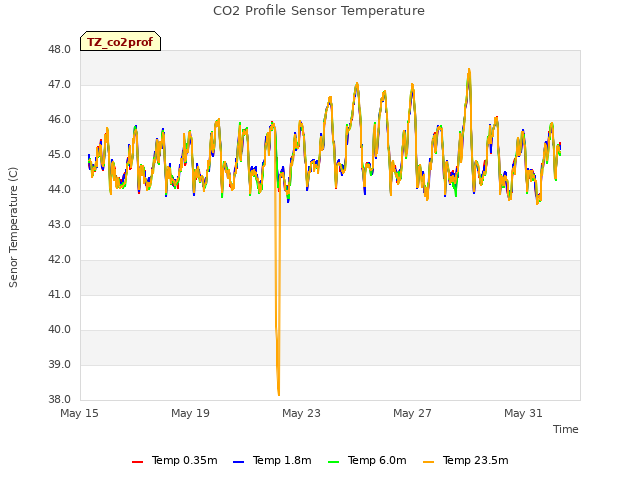
3 TZ_co2prof graphs found
No data found for TZ_irt.
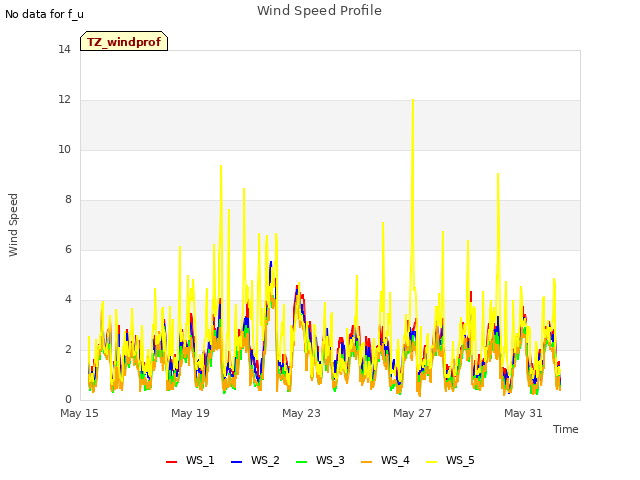
1 TZ_windprof graphs found
No data found for TZ_tflux.
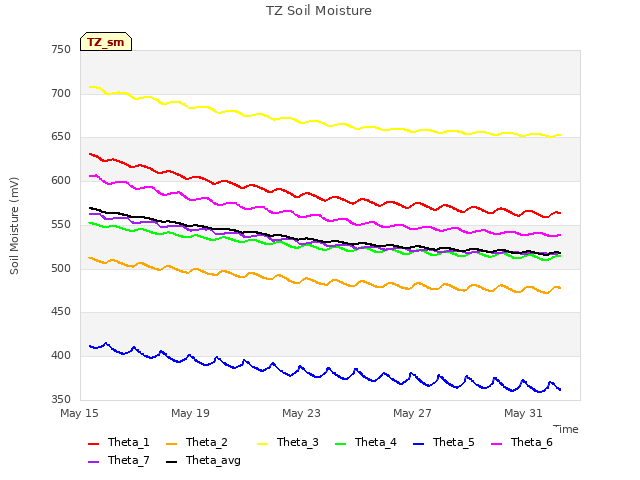
2 TZ_sm graphs found

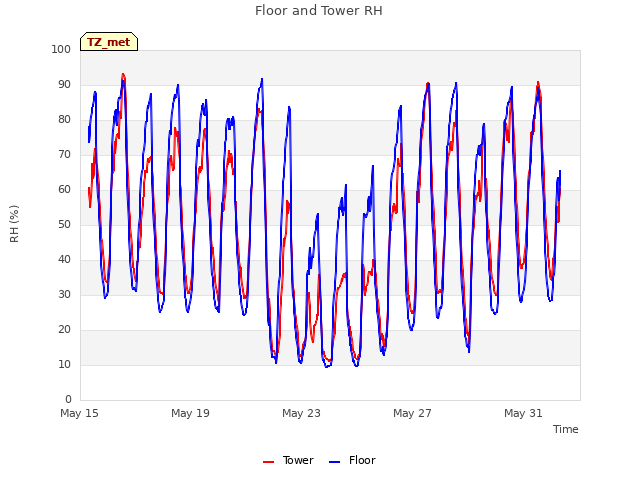
Can't check TZ_met
1 TZ_met graphs found
Can't check TZVR_mixed
No data found for TZ_osu.
No data found for TZ_fd.
Tonzi Z-cam data


