Field Notes
<--2007-04-27 11:45:00 |
2007-05-10 11:00:00-->
Other sites visited today:
Sherman Island
Phenocam link:
Searching...Tonzi: 2007-05-01 10:00:00 (DOY 121)
Author: Siyan Ma
Others:
When: Date: 5/1/2007 ,
Day: 121 ,
Watch Time: 10:00am .
Where: Tonzi/Vaira Ranch
Who: Siyan
Weather:
half clear, half cloudy. Mr. Tonzi said
if he saw goosy cloud, it supposed to rain in next days.
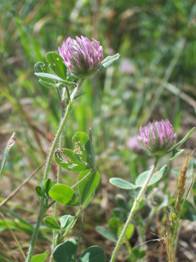
Phenology:
Varia grass starts turning to
yellow (~10%). Clovers dominated the
understory layer of the grassland and showed purple follows. Tonzi grass was still green with heading. Herbs showed yellow flowers all over the
ground. Talked with Mr. Tonzi. He recalled that 1932, 1948, and 1949 were
extremely cold years. Acorns depend on
April temperature. If temperature is
less than 15 -17 oC during April, maybe there are no acorns that
year. The year of 1955 had flooding in
the area. This information is good to
check with historic climate data.
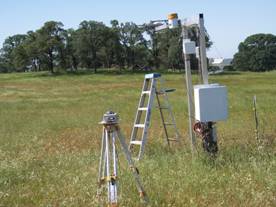
Summary
- Swapped Li-7500 on Tower and Floor
sites.
- Checked and downloaded data
at Tower, Floor, and Vaira. All is
well.
- Soil CO2 profile system still
works with the sensor’s measurable range.
This is a dry spring.
- Collected grass sample for
LAI and phenology in Tower and Vaira, oak branches for N.
- Measured soil moisture at
Vaira and Tonzi
- Read dendrometer
Vaira_Grass
Site
- Fence and gate power: >12 v.
- Panel and Batteries: 13.8 v; 12.4 amps; 2.9
amps.
- Reading from Gillsonic screen
before downloading data. (The value
of H2O and CO2 should be in the range of 0 – 5 v.)
Time
|
|
Path/File name
|
D:\Data\V07_ 121
.flx
D:\Data\VR07 .raw
|
|
mean
|
std
|
|
mean
|
std
|
w
|
0.06
|
0.273
|
Ts
|
16.93
|
0.309
|
u
|
-1.23
|
0.820
|
H2O
|
1.52
|
0.124
|
v
|
0.04
|
0.309
|
CO2
|
1.74
|
0.04
|
|
|
|
Tc
|
1.57
|
0.042
|
- downloading data
- check the fans of air temp.
and relative humidity sensors at Vaira. Good!
- Check MD-9 system connections. OK!
- Check levels of Radiation
sensors, clear up surfaces.
Yes. Slight bird crap on
4-way sensors.
9. Closed gate and
set up fence. Yes.
Tonzi_Tower Site
- Fence and gate power: 12
v.
- Panel and Batteries: 14.1 v; 0.0 amps; 5.0 amps.
- Reading from Gillsonic screen
before downloading data. (The value
of H2O and CO2 should be in the range of 0 – 5 v.)
Time
|
|
Path/File name
|
D:\Data\T07_
121 .flx
D:\Data\TW07 .raw
|
|
mean
|
std
|
|
mean
|
std
|
w
|
-0.33
|
0.504
|
Ts
|
19.24
|
0.950
|
u
|
-1.89
|
0.821
|
H2O
|
1.401
|
0.174
|
v
|
-0.99
|
0.471
|
CO2
|
1.777
|
0.036
|
- downloading data. Yes.
- swaping Li-7500
Analyzer. (Remove SN# 41 ; install SN# 976 )
- check the fans of air temp.
and relative humidity sensors on the tower and the floor. OK!
- Check calibration cylinders;
CO 2 1300 psig; flow 20
psi.
N 2 1000
psig; flow 20 psi.
Manually calibrate Li-800. Following Ted’s instruction: H:\IoneSavanna_2004\Tower_2004\CO2Profile\LI800_Calibration_Procedure_2Nov04.txt
Is the pump running OK.
How to check the CO2 values
Click “Ports/Flags” button to see which ports or flags is setting
high. Pressure should be less than
ambient value. When Flag 8 is high, it
may indicate that RRR’s battery is low. Ok.
Readings of CO2 profile system:
21.5
|
|
|
|
-1.2
|
12.03
|
|
|
|
939
|
374
|
380
|
383
|
385
|
44.9
|
938
|
936
|
930
|
931
|
49.3
|
945
|
945
|
945
|
945
|
423.7
|
949
|
959
|
949
|
950
|
939
|
|
|
|
|
44
|
|
|
|
|
49
|
- close gate and set up fence.
Toniz_Floor
Site
- Fence and gate power: 12
v.
- Panel and Batteries: 13.7 v; 8.2 amps; 1.7 amps.
- Reading from Gillsonic screen
before downloading data. (The value
of H2O and CO2 should be in the range of 0 – 5 v.)
Time
|
|
Path/File name
|
D:\Data\F07_ 121 .flx
D:\Data\FL07 .raw
|
|
mean
|
std
|
|
mean
|
std
|
w
|
0.15
|
0.21
|
Ts
|
21.2
|
1.64
|
u
|
0.07
|
0.28
|
H2O
|
2.4
|
0.11
|
v
|
0.06
|
0.73
|
CO2
|
1.7
|
0.02
|
- downloading data
- swaping Li-7500
Analyzer. (Remove SN# 418 ; install SN# 73 )
- Check MD-9 system connections
OK!
- Soil CO2 profile
Reading
from panels of analyzers
depth
|
Open
|
order
|
depth
|
Tree
|
order
|
2cm
(1%)
|
1650
|
1
|
2cm
(1%)
|
1840
|
1
|
4cm
|
2470
|
2
|
4cm
|
8040
|
4
|
8cm
|
4390
|
3
|
8cm
|
3530
|
2
|
16cm
|
6160
|
4
|
16cm
|
0.76%
|
3
|
- Close gate and set up fence.
tonzi
|
7931AFE
|
402165
|
574B4B
|
402FF3
|
574632
|
7A432E
|
7A3C6E
|
7A3B40
|
7A4AAA
|
1-May-07
|
121
|
|
|
|
|
|
|
|
|
|
SM
|
|
|
|
|
|
|
|
|
0-15
|
15.0
|
13.0
|
25.8
|
13.8
|
7.3
|
18.2
|
17.6
|
14.1
|
8.8
|
15-30
|
22.2
|
23.4
|
28.8
|
25.5
|
19.1
|
15.5
|
23.7
|
23.4
|
7.5
|
30-45
|
27.6
|
24.8
|
37.4
|
33.2
|
28.3
|
19.3
|
21.5
|
26.5
|
22.1
|
45-60
|
30.8
|
21.6
|
49.8
|
44.3
|
41.4
|
23.4
|
29.1
|
38.8
|
16.5
|
|
|
|
|
|
|
|
|
|
|
|
A6D882B
|
A3D04E8
|
A6D72F5
|
|
|
|
|
|
|
|
|
|
|
|
|
|
|
|
|
0-15
|
25.8
|
#DIV/0!
|
9.4
|
|
|
|
|
|
|
15-30
|
19.7
|
#DIV/0!
|
23.4
|
|
|
|
|
|
|
30-45
|
29.6
|
#DIV/0!
|
25.7
|
|
|
|
|
|
|
45-60
|
36.5
|
#DIV/0!
|
31.9
|
|
|
|
|
|
|
|
|
|
|
|
|
|
|
|
|
vaira
|
57318a
|
7933dee
|
|
|
|
|
|
|
|
0-15
|
3.6
|
6.8
|
|
|
|
|
|
|
|
15-30
|
9.1
|
14.9
|
|
|
|
|
|
|
|
30-45
|
14.0
|
16.7
|
|
|
|
|
|
|
|
45-60
|
16.9
|
21.7
|
|
|
|
|
|
|
|
Tonzi
|
|
|
|
Dendrometer
|
|
|
|
|
|
|
Date
|
Day
|
Tag #
|
Reading (cm)
|
5/1/2007
|
121
|
71
|
-
|
|
|
72
|
-
|
|
|
77
|
Broken
|
|
|
78
|
Broken
|
|
|
79
|
-
|
|
|
245
|
22.7
|
|
|
248
|
24.8 (out of range)
|
|
|
250
|
22.9
|
|
|
255
|
21.5
|
|
|
252
|
missing
|
|
|
102
|
Broken
|
|
Field Data
No tank data
No TZ Well data found
No TZ Moisture Point data found
No VR Moisture Point data found
No TZ grass heigth found
No VR grass heigth found
No TZ Tree DBH found
No water potential data found
No TZ Grass Biomass data found
No TZ OakLeaves Biomass data found
No TZ PineNeedles Biomass data found
0 photos found
16 sets found
No data found for TZ_Fenergy.
11 TZ_tmet graphs found


No data found for TZ_soilco2.
Can't check TZ_mixed
3 TZ_mixed graphs found


No data found for TZ_fflux.
8 TZ_fmet graphs found


No data found for TZ_tram.
3 TZ_co2prof graphs found


No data found for TZ_irt.
1 TZ_windprof graphs found

No data found for TZ_tflux.
2 TZ_sm graphs found


Can't check TZ_met
1 TZ_met graphs found

Can't check TZVR_mixed
No data found for TZ_osu.
No data found for TZ_fd.
Tonzi Z-cam data