
Field Notes
<--2015-06-03 09:30:00 | 2015-07-03 09:00:00-->Phenocam link: Searching...
Tonzi: 2015-06-17 10:00:00 (DOY 168)
Author: Siyan Ma
Others: Ana
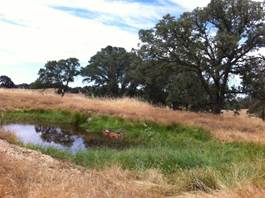
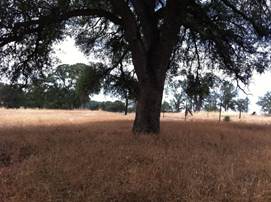
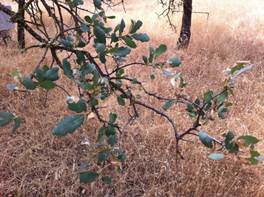
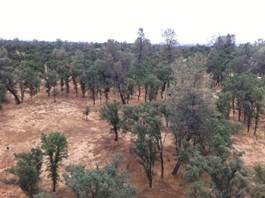
Summary: Standard fieldwork, grasses finally all dead, midday water potential
|
When: Date: 6/17/2015 , Day: 169 , Watch Time: 10:00 am . Where: Tonzi/Vaira Ranch Who: Siyan, Ana Weather: partially cloudy Phenology: yellow grasses and green oak leaves
Summary
Vaira_Grass Site
Tonzi_Tower Site
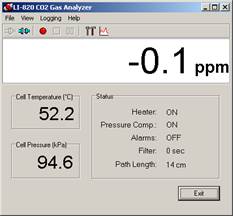
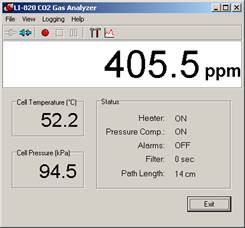
Is the pump running? YES! Before zero after zero
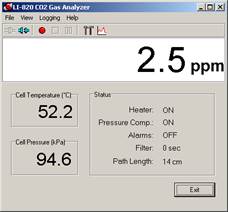
Before span
9. closed gate and set up fence. YES! Toniz_Floor Site
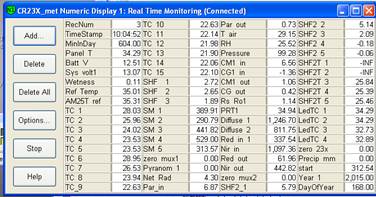
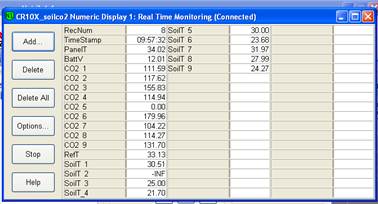
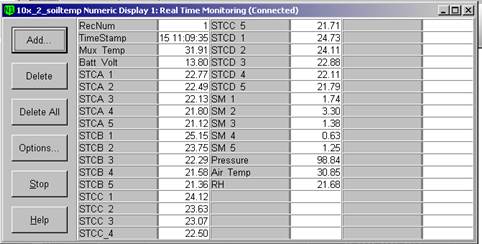
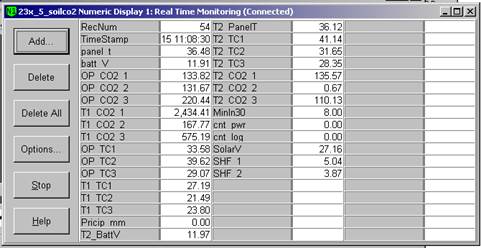
CR23X3 – floor-Met CR23X6 – tower-Met CR10X2 – floor-Met Soil CO2 profile: CR23X5 – soil CO2 profile
|
Field Data
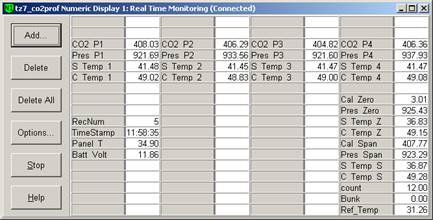
CO2 Profile Tanks
| Date | Tank | Pressure (psi) | ppm |
|---|---|---|---|
| 2015-06-17 | CO2 | 1500 | 405 |
| 2015-06-17 | N2 | 600 | 0 |
No TZ Well data found
mode = both
Moisture Point Probes TZ
Array
(
[0] => Tower_1
[1] => Floor_South_1
[2] => Floor_East_1
[3] => Floor_West_1
[4] => SoilCO2_1
[5] => Soil_Transect_4_1
[6] => Soil_Transect_3_1
[7] => Soil_Transect_2_1
[8] => Soil_Transect_1_1
[9] => SoilCO2_West_A_1
[10] => SoilCO2_West_B_1
[11] => SoilCO2_West_C_1
[12] => Tower_2
[13] => Floor_South_2
[14] => Floor_East_2
[15] => Floor_West_2
[16] => SoilCO2_2
[17] => Soil_Transect_4_2
[18] => Soil_Transect_3_2
[19] => Soil_Transect_2_2
[20] => Soil_Transect_1_2
[21] => SoilCO2_West_A_2
[22] => SoilCO2_West_B_2
[23] => SoilCO2_West_C_2
[24] => Tower_3
[25] => Floor_South_3
[26] => Floor_East_3
[27] => Floor_West_3
[28] => SoilCO2_3
[29] => Soil_Transect_4_3
[30] => Soil_Transect_3_3
[31] => Soil_Transect_2_3
[32] => Soil_Transect_1_3
[33] => SoilCO2_West_A_3
[34] => SoilCO2_West_B_3
[35] => SoilCO2_West_C_3
[36] => Tower_4
[37] => Floor_South_4
[38] => Floor_East_4
[39] => Floor_West_4
[40] => SoilCO2_4
[41] => Soil_Transect_4_4
[42] => Soil_Transect_3_4
[43] => Soil_Transect_2_4
[44] => Soil_Transect_1_4
[45] => SoilCO2_West_A_4
[46] => SoilCO2_West_B_4
[47] => SoilCO2_West_C_4
)
| Date | DOY | Rep | Depth | Tower_1 |
Floor_South_1 |
Floor_East_1 |
Floor_West_1 |
SoilCO2_1 |
Soil_Transect_4_1 |
Soil_Transect_3_1 |
Soil_Transect_2_1 |
Soil_Transect_1_1 |
SoilCO2_West_A_1 |
SoilCO2_West_B_1 |
SoilCO2_West_C_1 |
Tower_2 |
Floor_South_2 |
Floor_East_2 |
Floor_West_2 |
SoilCO2_2 |
Soil_Transect_4_2 |
Soil_Transect_3_2 |
Soil_Transect_2_2 |
Soil_Transect_1_2 |
SoilCO2_West_A_2 |
SoilCO2_West_B_2 |
SoilCO2_West_C_2 |
Tower_3 |
Floor_South_3 |
Floor_East_3 |
Floor_West_3 |
SoilCO2_3 |
Soil_Transect_4_3 |
Soil_Transect_3_3 |
Soil_Transect_2_3 |
Soil_Transect_1_3 |
SoilCO2_West_A_3 |
SoilCO2_West_B_3 |
SoilCO2_West_C_3 |
Tower_4 |
Floor_South_4 |
Floor_East_4 |
Floor_West_4 |
SoilCO2_4 |
Soil_Transect_4_4 |
Soil_Transect_3_4 |
Soil_Transect_2_4 |
Soil_Transect_1_4 |
SoilCO2_West_A_4 |
SoilCO2_West_B_4 |
SoilCO2_West_C_4 |
Avg | Spacial Count |
Measurement Count |
|---|---|---|---|---|---|---|---|---|---|---|---|---|---|---|---|---|---|---|---|---|---|---|---|---|---|---|---|---|---|---|---|---|---|---|---|---|---|---|---|---|---|---|---|---|---|---|---|---|---|---|---|---|---|---|
| 2015-06-17 | 168 | 0 | nan | 5.9 | 3.6 | 12.7 | 11.1 | 10.3 | 3.6 | 4.7 | 5.6 | 5.9 | 9.4 | 1.8 | 4.5 | 10.9 | 6.9 | 12.4 | 6.6 | 9.3 | 10.3 | 15.8 | 12.7 | 4.5 | 7.8 | 0.5 | 12.7 | 16.5 | 7.8 | 12.6 | 15.9 | 11.5 | 9.8 | 13.4 | 17.3 | 13.7 | 17.3 | 17.3 | 14.5 | 10.7 | 9.9 | 19.6 | 16.2 | 11.1 | 12.2 | 17.6 | 27.4 | 11.9 | 20.8 | 19.6 | 23.4 | |||
| 2015-06-17 | 168 | 1 | nan | 6.2 | 3.6 | 12.7 | 12.4 | 10.9 | 3 | 4.7 | 5.3 | 5 | 8.8 | 5.3 | 4.7 | 10.6 | 7.2 | 11.2 | 4.5 | 9.4 | 10.3 | 15.2 | 12.7 | 4.5 | 8.1 | 0.2 | 12.7 | 15.9 | 8.1 | 13.1 | 15.9 | 11.5 | 10.1 | 13.4 | 17.6 | 14 | 15.9 | 16.8 | 14.3 | 9.6 | 10.2 | 19.3 | 18.2 | 12.2 | 17.3 | 27.1 | 11.6 | 19.9 | 18.8 | 22.2 | ||||
| 2015-06-17 | 168 | Avg | 0-15cm | 0 | 0 | |||||||||||||||||||||||||||||||||||||||||||||||||
| 2015-06-17 | 168 | Avg | 15-30cm | 0 | 0 | |||||||||||||||||||||||||||||||||||||||||||||||||
| 2015-06-17 | 168 | Avg | 30-45cm | 0 | 0 | |||||||||||||||||||||||||||||||||||||||||||||||||
| 2015-06-17 | 168 | Avg | 45-60cm | 0 | 0 |
mode = both
Moisture Point Probes VR
Array
(
[0] => Solar_Panels_1
[1] => Flux_Tower_1
[2] => Gate_1
[3] => Biomass_Cage_1
[4] => Solar_Panels_2
[5] => Flux_Tower_2
[6] => Gate_2
[7] => Biomass_Cage_2
[8] => Solar_Panels_3
[9] => Flux_Tower_3
[10] => Gate_3
[11] => Biomass_Cage_3
[12] => Solar_Panels_4
[13] => Flux_Tower_4
[14] => Gate_4
[15] => Biomass_Cage_4
)
| Date | DOY | Rep | Depth | Solar_Panels_1 |
Flux_Tower_1 |
Gate_1 |
Biomass_Cage_1 |
Solar_Panels_2 |
Flux_Tower_2 |
Gate_2 |
Biomass_Cage_2 |
Solar_Panels_3 |
Flux_Tower_3 |
Gate_3 |
Biomass_Cage_3 |
Solar_Panels_4 |
Flux_Tower_4 |
Gate_4 |
Biomass_Cage_4 |
Avg | Spacial Count |
Measurement Count |
|---|---|---|---|---|---|---|---|---|---|---|---|---|---|---|---|---|---|---|---|---|---|---|
| 2015-06-17 | 168 | 0 | nan | 4.7 | 5 | 3.6 | 0.6 | 13.6 | 11.8 | 10 | 55.1 | 16.2 | 5.6 | 14 | 12.3 | 27.9 | 24.2 | 11.9 | 15.3 | |||
| 2015-06-17 | 168 | 1 | nan | 4.5 | 5.3 | 7.1 | 0.3 | 13.3 | 11.2 | 9.3 | 5.4 | 16.2 | 5.9 | 13.1 | 12.3 | 28.8 | 13.6 | 11.3 | 14.8 | |||
| 2015-06-17 | 168 | Avg | 0-15cm | 0 | 0 | |||||||||||||||||
| 2015-06-17 | 168 | Avg | 15-30cm | 0 | 0 | |||||||||||||||||
| 2015-06-17 | 168 | Avg | 30-45cm | 0 | 0 | |||||||||||||||||
| 2015-06-17 | 168 | Avg | 45-60cm | 0 | 0 |
No TZ grass heigth found
No VR grass heigth found
Tree DBH
| Date | Tag# | Reading (mm) |
|---|---|---|
| 2015-06-17 | 102 | 11.8 |
| 2015-06-17 | 245 | 22.0 |
| 2015-06-17 | 72 | 20.1 |
| 2015-06-17 | 79 | 18.2 |
Water Potential - mode: raw
| Time | Species | Tree | readings (bar) | ||
|---|---|---|---|---|---|
| 2015-06-17 13:23:00 | OAK | 102 | -23.5 | -25.5 | -31.5 |
| 2015-06-17 13:23:00 | OAK | 35 | -25 | -30 | -25 |
| 2015-06-17 13:23:00 | OAK | 92 | -27 | -23 | -10 |
| 2015-06-17 13:33:00 | PINE | OLD | -15 | -3.5 | -12 |
| 2015-06-17 13:33:00 | PINE | YNG | -13 | -25 | -27 |
No TZ Grass Biomass data found
No TZ OakLeaves Biomass data found
No TZ PineNeedles Biomass data found
0 photos found
16 sets found
No data found for TZ_Fenergy.
11 TZ_tmet graphs found
11 TZ_soilco2 graphs found
Can't check TZ_mixed
3 TZ_mixed graphs found
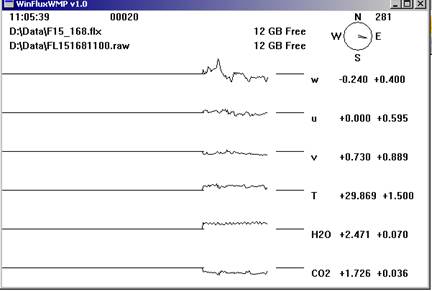
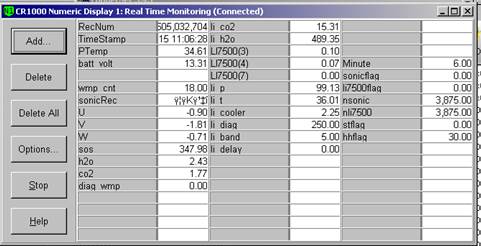
1 TZ_fflux graphs found
8 TZ_fmet graphs found
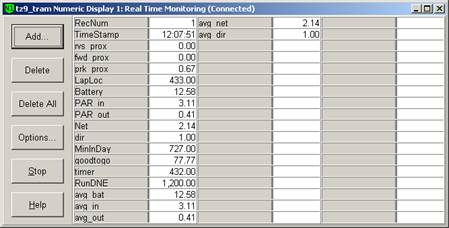
1 TZ_tram graphs found
3 TZ_co2prof graphs found
1 TZ_irt graphs found
No data found for TZ_windprof.
1 TZ_tflux graphs found
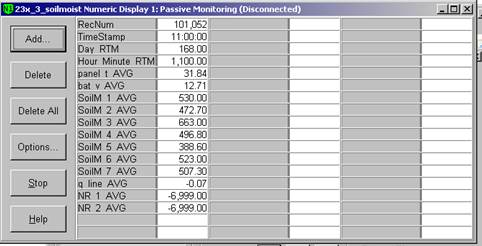
2 TZ_sm graphs found
Can't check TZ_met
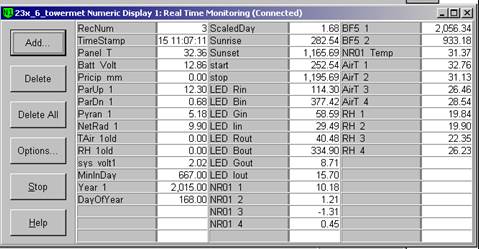
1 TZ_met graphs found
Can't check TZVR_mixed
8 TZ_osu graphs found
No data found for TZ_fd.
Tonzi Z-cam data