Field Notes
<--2014-06-26 09:10:00 | 2014-07-02 09:30:00-->Phenocam link: Searching...
Sherman Island: 2014-06-30 11:00:00 (DOY 181)
Author: Joe Verfaillie
Others: Ryan
Summary: Picarro / Forerunner chamber experiment field measurements, fixed HMP45 fan
| Sherman 2014-06-30 I arrived about 11am with Ryan from Whendee’s lab. It was super hot with very little breeze. Ryan did syringe samples from three static chambers. I did the LI6400 soil chamber measurements. I worked the soil collars from west to east and redid number two at the end because I think I interrupted the measurement the first time. There are two files on the LI6400: SI_20140630 is a false start. SI2_20140630 should be good. I also ran ultra zero air, Scotty N2O, and Ameriflux standard gasses through the Picarro. The Ameriflux standard has 1.9645 +- 0.002ppm CH4, 456.55 +- 0.02ppm CO2 12:13 to 12:20 ultra zero air: 0.007 N2O, 0.038 CH4, 8.804 CO2 12:21 to 12:28 1ppm N2O: 0.998 N2O 12:28 to 12:36 Ameriflux: 2.001 CH4, 472.53 CO2 I copied the raw Picarro files to usb, but the Forerunner software was too slow to download, so I left it processing and thought we could get it over the internet. I also replaced the fan in the HMP45 on the tower and collected the Vaisala soil co2 and met data. |
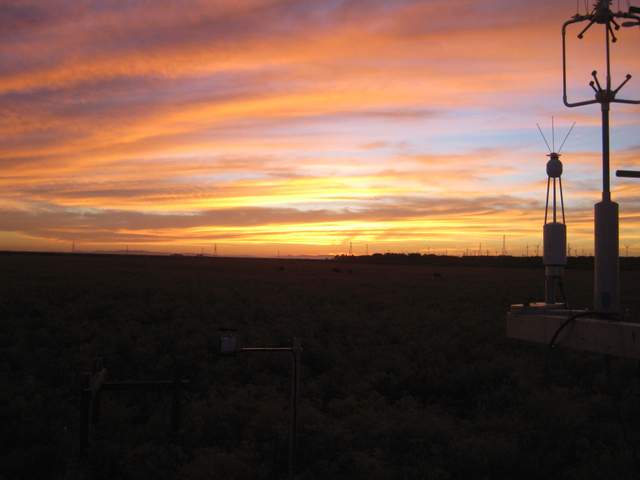
1 photos found

SI_autocam_20140630_1945.jpg ( 2014-06-30 19:45:02 ) Full size: 1920x1440
Nice sunset
7 sets found
No data found for SI_mp.
11 SI_met graphs found
Can't check SI_mixed
2 SI_mixed graphs found
4 SI_flx graphs found
4 SI_soilco2 graphs found
Can't check TWSI_mixed
Can't check SIMBTWEE_met

