
Site: West Pond (WP) aka US-Tw1
2012-04-24 - 2024-05-01
The Twitchell Wetland site is a 7.4-acre restored wetland on Twitchell Island, that is managed by the California Department of Water Resources (DWR) and the U.S. Geological Survey (USGS). In the fall of 1997, the site was permanently flooded to a depth of approximately 25 cm. The wetland was almost completely covered by cattails and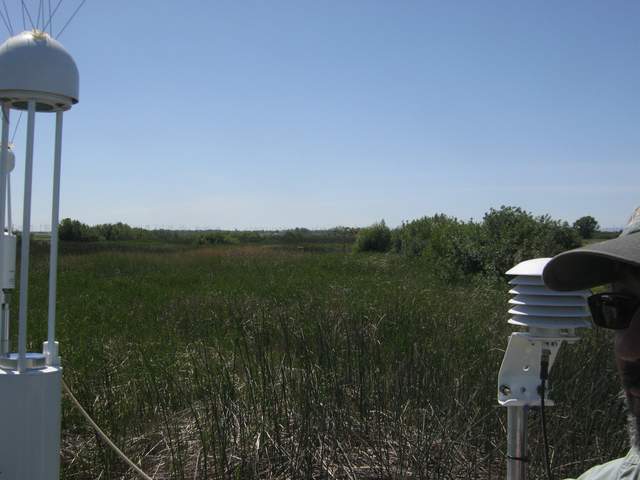
tules by the third growing season. A flux tower equipped to analyze energy, H2O, CO2, and CH4 fluxes was installed on May 17, 2012.
Last field site visit: more fieldnotes
| 2024-05-01 10:00:00 | Removing all sensors and equipment, only solar panels, one TC set, scaffolding and some structural parts left. |
Latest data processing: more processing notes
| 2021-03-15 | 7700 time sync error fixed after 7550 firmware upgrade, all 7500 data filtered out on 2021-01-28 for dates: 2021-01-01 - 2021-03-03 |
| Processor of record: 2013-02-05 - Not Known 2013-07-30 - Cove Sturtevant 2013-08-07 - Sara Knox 2016-06-01 - Kyle Hemes 2016-09-09 - Elke Eichelmann 2018-05-23 - Alex Valach 2021-01-07 - Daphne Szutu |
Ameriflux Author:
20120424 - Joseph Verfaillie 20120424 - Dennis Baldocchi 20130807 - Sara Knox 20160429 - Kyle Hemes 20160801 - Elke Eichelmann 20161200 - Daphne Szutu 20180212 - Alex Valach 20210304 - Robert Shortt |
Data Digital Object Identifier (DOI)
AmeriFlux: https://doi.org/10.17190/AMF/1246147
FLUXNET: https://doi.org/10.17190/AMF/1832165
FLUXNET-CH4: https://doi.org/10.18140/FLX/1669696
FLUXNET2015: https://doi.org/10.18140/FLX/1440108
Equipment Locations
more details
| Equipment | Start Date | End Date | X | Y | Z | Notes |
|---|---|---|---|---|---|---|
| Anemometer | 2012-05-02 | 2023-09-12 | 0 | 0 | 4.39 | Heading=352deg from fn WP2013-07-16 height 4.64m on that day. From fn WP2018-03-07 3.69m to water |
| 2023-09-12 | - | Heading measured at 18 deg true N | ||||
| Anemometer ATI | 2012-10-18 | 2012-11-08 | ATI sonic inter-comparison | |||
| Barometer | 2012-04-17 | - | 1.03 | 2.1 | 2.02 | |
| Battery Bank | 2012-05-02 | - | ||||
| Camera | 2012-07-05 | - | 4 | |||
| CO2 probe A | 2013-01-23 | - | 1.13 | 2.87 | 0 | |
| CO2 Probe B | 2014-01-23 | - | ||||
| Conductivity Sensor | 2012-04-17 | - | 1.13 | 2.87 | 0 | |
| Data Logger ATI | 2012-10-18 | 2012-11-08 | ATI sonic inter-comparison | |||
| Data Logger Met | 2012-04-17 | - | 0.96 | 1.91 | 2.42 | Met |
| Data Logger Test | 2020-11-19 | - | For cross comparison, mounted in box just south of 7550 | |||
| DO Sensor A | 2014-09-25 | 2014-10-09 | 0.13 | |||
| 2018-05-31 | - | |||||
| DO Sensor B | 2014-09-25 | 2014-10-09 | 0.075 | |||
| DO Sensor C | 2014-09-25 | 2014-10-09 | 0.02 | |||
| DO Sensor Lower | 2012-07-05 | - | ||||
| DO Sensor Upper | 2012-04-17 | 2013-01-03 | 1.13 | 2.87 | 0 | |
| Gas Analyzer CH4 | 2012-05-02 | - | 0.23 | 0.21 | 4.3 | CH4 |
| Gas Analyzer CO2/H2O | 2012-05-02 | - | 0.09 | 0.18 | 4.39 | CO2/H2O |
| Interface A547 | 2012-04-17 | - | ||||
| Interface LI-7550 | 2012-05-02 | - | 0.84 | 1.61 | 1.82 | LI-7550 |
| Interface NL115 ATI | 2012-10-18 | 2012-11-08 | ATI sonic inter-compairson | |||
| Multiplexer Met | 2012-04-17 | - | 0.96 | 1.91 | 2.02 | |
| Multiplexer Thermocouples | 2012-04-17 | - | 1.03 | 2.1 | 2.22 | |
| Narrow Band NDVI Incoming | 2017-06-05 | - | 3.8 | NDVI Incoming | ||
| Narrow Band NDVI Reflected | 2017-06-05 | - | 3.7 | NDVI Reflected | ||
| Net Radiometer | 2012-04-17 | - | -0.18 | -0.9 | 3.75 | |
| PAR Sensor Incoming | 2012-04-17 | - | -0.07 | -0.64 | 3.8 | Incoming |
| PAR Sensor Incoming Cal | 2020-11-19 | - | ||||
| PAR Sensor Reflected | 2012-04-17 | - | -0.07 | -0.64 | 3.7 | Reflected |
| PAR Sensor Reflected Cal | 2020-12-16 | - | ||||
| PAR Sensor Test | 2020-11-19 | - | for cross comparison just north of permanent | |||
| RH & Temp | 2012-04-17 | - | 0.65 | 0.9 | 4.19 | |
| RH & Temp Test | 2020-11-19 | - | for cross comparison just south of permanent | |||
| Solar Controller | 2012-05-02 | - | ||||
| Solar Panel A | 2012-05-02 | 2017-05-18 | ||||
| Solar Panel B | 2012-05-02 | 2017-05-18 | ||||
| Solar Panel C | 2012-05-02 | 2017-05-18 | ||||
| Thermocouple Profile A | 2012-04-17 | - | -0.03 | 0.53 | -0.32 | |
| 2012-04-17 | - | -0.03 | 0.53 | -0.16 | ||
| 2012-04-17 | - | -0.03 | 0.53 | -0.08 | ||
| 2012-04-17 | - | -0.03 | 0.53 | -0.04 | ||
| 2012-04-17 | - | -0.03 | 0.53 | -0.02 | ||
| 2012-07-05 | - | -0.03 | 0.53 | 0.04 | ||
| 2012-07-05 | - | -0.03 | 0.53 | 0.08 | ||
| 2012-07-05 | - | -0.03 | 0.53 | 0.16 | ||
| Thermocouple Profile B | 2012-04-17 | - | 1.5 | 2.72 | -0.32 | |
| 2012-04-17 | - | 1.5 | 2.72 | -0.16 | ||
| 2012-04-17 | - | 1.5 | 2.72 | -0.08 | ||
| 2012-04-17 | - | 1.5 | 2.72 | -0.04 | ||
| 2012-04-17 | - | 1.5 | 2.72 | -0.02 | ||
| 2012-07-05 | - | 1.5 | 2.72 | 0.04 | ||
| 2012-07-05 | - | 1.5 | 2.72 | 0.08 | ||
| 2012-07-05 | - | 1.5 | 2.72 | 0.16 | ||
| Thermocouple Profile C | 2012-04-17 | - | 3.25 | 1.9 | -0.32 | |
| 2012-04-17 | - | 3.25 | 1.9 | -0.16 | ||
| 2012-04-17 | - | 3.25 | 1.9 | -0.08 | ||
| 2012-04-17 | - | 3.25 | 1.9 | -0.04 | ||
| 2012-04-17 | - | 3.25 | 1.9 | -0.02 | ||
| 2012-07-05 | - | 3.25 | 1.9 | 0.04 | ||
| 2012-07-05 | - | 3.25 | 1.9 | 0.08 | ||
| 2012-07-05 | - | 3.25 | 1.9 | 0.16 | ||
| Water Level | 2012-04-17 | 2012-07-12 | 1 | 4.04 | 0.404 | Sensor moved, Height calibrated against staff gauge |
| 2012-07-12 | 2023-08-08 | 1 | 4.04 | -0.357 | Offset calibrated against staff gauge n=49 R2=97 | |
| 2023-08-08 | - | 1 | 4.04 | -0.12 | Offset calibrated against staff gauge | |
| Weather Station | 2021-06-22 | - |
Data Streams:
more data
| Code | First Day | Last Day | Description |
|---|---|---|---|
| WP_arable | 2021-06-22 | 2024-05-01 | Hourly met data from an Arable Mark II device. Raw times are in UTC, hourly averages with the time at the beginning of the averaging period - stored in PST at end of averaging period. |
| WP_cam | 2012-07-05 | 2024-05-01 | RGB digital number data extracted from autocam photos from four photos from 13:25 to 14:45 Phenocam archive |
| WP_flux | 2012-05-02 | 2024-01-04 | 30 minute averages of the 10Hz flux data. |
| WP_met | 2012-04-24 | 2024-05-01 | Met data from the West Pond collected with a CR1000 data logger. |
| WP_minidot | 2018-05-31 | 2024-01-11 | Dissolved oxygen from the minidot sensor at the tower |
| WP_processed | 2012-07-13 | - | Processed data equivalent to L1, L2, L3 and Ameriflux outputs from the Matlab processing. |
| WP_processed3 | 2012-07-13 | - | Gap filled and partitioned data from Level 3 processing |
Metadata and Data Sets:
more data
| Id | Type | Site | Dates | Frequency | Title | Description |
|---|---|---|---|---|---|---|
| 10 | Leaf Level | EE, WP, SW | 2017-07-12 - 2018-06-26 | Handful of dates | LI-6400 measurements of Tule and Cattail | Leaf level measurements of tule and cattails including at least one 24 hour measurement period. More details needed here. |
| 26 | Lidar | BA, BC, EE, MB, SB, SW, TA, WP | 2016-12-01 - 2017-03-07 | Once | Delta-wide USGS Lidar flight | Winter time Lidar flight commissioned by the USGS and flown by Woolpert. Horizontal datum: NAD83 (NSRS2007) Epoch 2017.95, UTM Zone 10N, meters. Vertical datum: NAVD88, GEOID12B, US Survey Feet, Orthometric. Includes classified point cloud, features shape files, bare earth DEM, orthometric imagery (0.3-meter16-bit 4-band RGB-IR tiles in TIFF format with World Files). The entire Delta is covered by 8 points per m2, 0.5m DEM. |
| 3 | Lidar | BA, BC, WP, EP, EE, TA, TW, MB, SB, SW | 2018-09-20 | Once | NCALM Lidar Flight | Lidar flight data collection from Kyle Hemes NCAL project: Ecosystem Structure as a Driver of Climatic, Habitat, and Hydrological Services in Heterogeneous Restored Wetlands. Point clouds (*.las files), 1m resolution DEM and DSM (arcgis GridFloat files), visible imagery (*.tif files) of Sherman, Twitchel and Bouldin Islands. UTM Zone 10N, meters, NAD83(2011) epoch 2010.00 / NAVD88 (GEOID12B) |
| 35 | Soils | WP, MB | 2013-08-30 - 2013-10-14 | Once | Delta-wide soil survey by JGI Susannah Tringe | Soil samples collected by Wyatt Hartman and Susie Theroux from Susannah Tringe's group at LBL. Sites were sampled for bulk density, C/N/anions/elements in the soil and porewater, and microbial communities. Soil samples were incubated in the lab to measure greenhouse gas fluxes. |
Cospectra_Comparison_Delta.pdf - Plots of cospectra from the Delta sights
PilotPondsProjectInfo.pdf -
ATI_Gill_compare_SI_WP_TT.pdf - An ATI orthogonal sonic was borrowed from the Goldstein Lab and intercompared with Gill sonics at Sherman Island, West Pond and Tonzi Ranch.
PondMap.png - Diagram of West Pond and East Pond including boardwalks, inlets and outlets
HMP RH and AirT Comparison 12-2017
Delta SW PAR Comparison 10-2016
Water Level sensor calibration with staff gauge
WP Golden Set comparison 2020
West Pond - NDVI (SRS, Planet)
West Pond - Radiometer Calibration 2021
Camera comparison at West Pond
Conductivity CS547A TempCoef