
Site: Tonzi (TZ) aka US-Ton
2000-01-01 - Present
Located in the lower foothills of the Sierra Nevada Mountains, the Tonzi Ranch site is classified as an oak savanna woodland on privately owned land. Managed by local rancher, Russell Tonzi, brush has been periodically removed for cattle grazing. The overstory is dominated by blue oak trees (40% of total vegetation) with intermittent grey pine trees (3 trees/ha). Understory species include a variety of grasses and herbs, including purple false brome, smooth cat's ear, and rose clover. These two distinctive layers operate in and out from one another. Growing season of the understory is confined to the wet season only, typically from October to early May. In contrast, the deciduous blue oak trees are dormant during the rainy winter months and reach maximum LAI in April. The blue oak ecosystem rings the Great Central Valley of California, inhabiting the lower reaches of the Sierra Nevada foothills.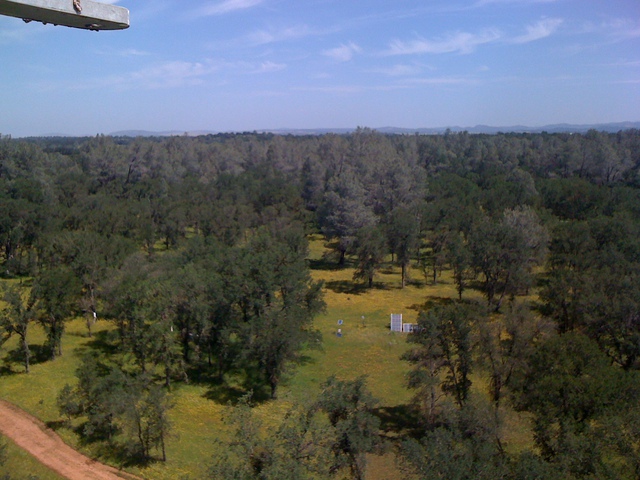
Last field site visit: more fieldnotes
| 2024-05-15 12:15:00 | Maintenance trip, total revamp of soil co2 infrastructure, added reflected PAR, UC Davis was there to get SIF running again. |
Latest data processing: more processing notes
| 2024-04-15 | clean met for quarterly processing for dates: 2024-01-01 - 2024-04-09 |
| Processor of record: 2002-07-08 - Dennis Baldocchi 2003-12-31 - Liukang Xu 2005-03-07 - Siyan Ma 2019-01-17 - Joe Verfaillie 2019-04-23 - Siyan Ma 2022-09-13 - Joe Verfaillie |
Ameriflux Author:
20010000 - Dennis Baldocchi 20010200 - Liukang Xu 20050000 - Siyan Ma 20080900 - Joseph Verfaillie |
Data Digital Object Identifier (DOI)
AmeriFlux: https://doi.org/10.17190/AMF/1245971
FLUXNET: https://doi.org/10.17190/AMF/2204880
FLUXNET2015: https://doi.org/10.18140/FLX/1440092
Equipment Locations
more details
| Equipment | Start Date | End Date | X | Y | Z | Notes |
|---|---|---|---|---|---|---|
| Anemometer | 2001-03-01 | - | 0 | 0 | 23.43 | |
| Anemometer 2D Profile | 2003-07-25 | 2008-12-11 | 1.34 | 10.61 | ||
| 2003-07-25 | 2008-12-11 | 1.34 | 11.76 | |||
| 2003-07-25 | 2008-12-11 | 1.34 | 13.21 | |||
| 2003-07-25 | 2008-12-11 | 1.34 | 15.04 | |||
| 2003-07-25 | 2008-12-11 | 1.34 | 16.86 | |||
| Anemometer Cal | 2021-02-10 | - | 23.43 | For inter-comparison | ||
| Anemometer Floor | 2001-03-01 | - | -18.36 | 80.54 | 2.1 | |
| Battery Bank | 2001-05-18 | - | ||||
| Battery Bank Floor | 2001-01-03 | - | ||||
| Battery Bank soil co2 | 2002-12-23 | - | ||||
| Camera Thermal | 2018-06-01 | - | 0.16 | 1.34 | 17.98 | |
| CO2 Probe Open Profile | 2002-06-02 | - | -53.65 | 130.52 | -0.02 | East Open |
| 2002-06-02 | - | -53.67 | 130.42 | -0.08 | East Open | |
| 2002-06-02 | - | -53.69 | 130.32 | -0.16 | East Open | |
| 2002-06-02 | - | -53.71 | 130.22 | -0.04 | East Open | |
| CO2 Probe Tower Profile | 2018-02-07 | - | 23 | |||
| 2018-02-07 | - | 0.35 | ||||
| 2018-02-07 | - | 1.8 | ||||
| 2018-02-07 | - | 6 | ||||
| CO2 Probe Tree1 Profile | 2002-06-02 | - | -0.02 | West Under Tree | ||
| 2002-06-02 | - | -0.08 | West Under Tree | |||
| 2002-06-02 | - | -0.16 | West Under Tree | |||
| 2002-06-02 | - | -0.04 | West Under Tree | |||
| CO2 Probe Tree2 Profile | 2012-04-05 | - | -0.02 | Near Liukang Tree | ||
| 2012-04-05 | - | -0.04 | Near Liukang Tree | |||
| 2012-04-05 | - | -0.08 | Near Liukang Tree | |||
| 2017-09-14 | - | -0.16 | Near Liukang Tree | |||
| Data Logger C1 | 2024-03-07 | - | Cluster 1 oak aka ptden Tree 2 | |||
| Data Logger Cal | 2021-01-21 | 2021-03-02 | ||||
| Data Logger IRT | 2015-05-06 | - | Small tree crown and graound IRT | |||
| Data Logger Oak11820 | 2024-03-26 | - | South of the Tower near C4 aka ptden Tree 5 | |||
| Data Logger Oak11841 | 2024-03-07 | - | South of Tower near Zcam1 aka ptden Tree 4 | |||
| Data Logger Oak11908 | 2024-03-07 | - | West of the Tower aka ptden Tree 3 | |||
| Data Logger Oak88 | 2024-03-07 | - | NorthWest of Tower aka ptden Tree 1 | |||
| Data Logger Soil CO2 | 2002-06-20 | 2022-10-05 | main logger | |||
| Data Logger SP1 | 2012-01-06 | - | 0.6 | |||
| Data Logger Tree 2 | 2012-03-02 | 2021-08-11 | ||||
| Dendrometer C1 | 2022-11-03 | - | Cluster 1 oak aka ptden Tree 2 | |||
| Dendrometer C5 | 2024-03-07 | - | Small oak Cluster 5 | |||
| Dendrometer LiLPine | 2024-03-26 | - | Little pine next to cluster oak 1 | |||
| Dendrometer Oak102 | 2024-03-07 | - | Leaf water potential oak 102 | |||
| Dendrometer Oak11820 | 2022-11-03 | - | South of the Tower near C4 aka ptden Tree 5 | |||
| Dendrometer Oak11841 | 2022-11-03 | - | South of Tower near Zcam1 aka ptden Tree 4 | |||
| Dendrometer Oak11908 | 2022-11-03 | - | West of the Tower aka ptden Tree 3 | |||
| Dendrometer Oak88 | 2022-11-03 | - | NorthWest of Tower aka ptden Tree 1 | |||
| Dendrometer OakLK | 2024-03-07 | - | Large Liukang Oak Leaf water potential tree 92 | |||
| Dendrometer Pine11833 | 2024-03-07 | - | Large pine id 11833 to the south of the tower near cluster tree 7 | |||
| Forced Diffusion Open | 2017-10-25 | - | -53.78 | 131.09 | 0 | |
| Forced Diffusion Tree 1 | 2017-10-18 | - | 0 | |||
| Gas Analyzer CO2/H2O | 2001-03-01 | - | 0 | 0.24 | 23.43 | |
| Gas Analyzer CO2/H2O Floor | 2001-03-01 | - | -18.36 | 80.14 | 2.1 | |
| Heat Flux Plate A | 2001-01-05 | - | -0.1 | |||
| Heat Flux Plate B | 2001-01-05 | - | -0.1 | |||
| Heat Flux Plate C | 2001-01-05 | - | -0.1 | |||
| Heat Flux Plate D | 2001-01-05 | - | -0.1 | |||
| Heat Flux Plate E | 2001-01-05 | - | -0.1 | |||
| Heat Flux Plate F | 2013-04-24 | - | -0.02 | Near soil CO2 | ||
| Heat Flux Plate G | 2013-04-24 | - | -0.02 | Near soil CO2 | ||
| Heat Flux Plate SP1 A | 2012-01-06 | - | -0.12 | Original | ||
| Heat Flux Plate SP1 B | 2012-01-06 | - | -0.12 | Original | ||
| Infrared Temperature Grass A | 2015-05-06 | - | Long term near small tree | |||
| Infrared Temperature Grass B | 2019-05-30 | - | Unshaded grass | |||
| Infrared Temperature Grass B cal | 2019-05-30 | 2019-11-19 | Near Floor solar panels in FLIR FOV | |||
| Infrared Temperature Ref Panel A | 2018-06-01 | - | Near Floor tower, black plywood | |||
| Infrared Temperature Ref Panel B | 2019-01-13 | - | Concrete panel with five TCs near Floor solar panels | |||
| Infrared Temperature Tree Bole | 2019-05-30 | - | North of Floor solar panels in FLIR FOV | |||
| Infrared Temperature Tree Bole cal | 2019-05-30 | - | North of Floor solar panels in FLIR FOV | |||
| Infrared Temperature Tree Crown | 2015-05-06 | - | Long term looking down on top of small tree | |||
| Interface LI-7550 | 2001-03-01 | - | 0.16 | 0.04 | 19.84 | |
| Interface LI-7550 Floor | 2001-03-01 | - | ||||
| Multiplexer Tower | 2001-10-01 | - | 20 | |||
| Net Radiometer SP1 4-way | 2012-01-06 | - | 1 | |||
| PAR Sensor Incoming | 2001-03-01 | - | 21.5 | |||
| PAR Sensor Incoming Cal | 2021-01-21 | 2021-02-10 | For inter-comparison | |||
| PAR Sensor Reflected | 2001-05-20 | - | ||||
| PAR Sensor Reflected Cal | 2021-02-10 | 2021-03-02 | ||||
| PAR Sensor Under-A | 2020-04-18 | - | 1 | Under Canopy PAR | ||
| Precipitation | 2011-03-08 | - | Moved to ground near soil co2 | |||
| Precipitation SP1 | 2012-01-06 | - | 0.3 | |||
| Radio Cell Modem | 2022-02-09 | - | Amerilfux provided, top of tower | |||
| Radio IRT | 2020-03-02 | - | Radio for small tree IRT system | |||
| RH & Temp | 2001-03-01 | - | 6.67 | 12.89 | 1.69 | |
| 2001-05-18 | - | 23 | ||||
| RH & Temp Cal A | 2021-01-21 | 2021-03-02 | ||||
| RH & Temp Floor | 2001-10-01 | - | start date a guess | |||
| Soil Moisture Probe A -0.20m Grass | 2001-01-03 | - | -0.2 | |||
| Soil Moisture Probe B -0.20m Tree | 2001-01-03 | - | -0.2 | |||
| Soil Moisture Probe C -0.20m Grass | 2001-01-03 | - | -0.2 | |||
| Soil Moisture Probe D -0.25m Tree | 2001-01-03 | - | -0.25 | |||
| Soil Moisture Probe E -0.00m | 2001-01-03 | - | 0 | |||
| Soil Moisture Probe F -0.50m | 2001-03-01 | - | -0.5 | |||
| Soil Moisture Probe G -0.50m | 2001-03-01 | - | -0.5 | |||
| Soil Moisture Probe H Profile | 2022-05-26 | - | -0.05,-0.1,-0.2,-0.3,-0.4,-0.5 | |||
| Soil Moisture Probe I Profile | 2022-06-07 | - | -0.05,-0.1,-0.2,-0.3,-0.4,-0.5 | |||
| Soil Moisture Probe J Profile | 2022-06-07 | - | ||||
| Soil Moisture Probe SP1 SM Profile | 2012-01-06 | - | -0.02 | |||
| 2012-01-06 | - | -0.05 | ||||
| 2012-01-06 | - | -0.1 | ||||
| 2012-01-06 | - | -0.2 | ||||
| 2012-01-06 | - | -0.4 | ||||
| 2012-01-06 | - | -0.6 | ||||
| 2012-01-06 | - | -0.8 | ||||
| Soil Water Potential B | 2022-04-27 | - | ||||
| Soil Water Potential C | 2022-06-07 | - | -10 | |||
| Solar Controller Soil CO2 | 2004-01-01 | - | begin data is guess | |||
| Solar Panel Floor G | 2001-01-03 | 2012-02-09 | ||||
| Solar Panel Floor H | 2001-01-03 | 2012-02-09 | ||||
| Thermocouple Profile A | 2001-01-03 | - | -0.02 | |||
| 2001-01-03 | - | -0.04 | ||||
| 2001-01-03 | - | -0.08 | ||||
| 2001-01-03 | - | -0.16 | ||||
| 2001-01-03 | - | -0.32 | ||||
| Thermocouple Profile B | 2001-01-03 | - | -0.02 | |||
| 2001-01-03 | - | -0.04 | ||||
| 2001-01-03 | - | -0.08 | ||||
| 2001-01-03 | - | -0.16 | ||||
| 2001-01-03 | - | -0.32 | ||||
| Thermocouple Profile C | 2001-01-03 | - | -0.02 | |||
| 2001-01-03 | - | -0.04 | ||||
| 2001-01-03 | - | -0.08 | ||||
| 2001-01-03 | - | -0.16 | ||||
| 2001-01-03 | - | -0.32 | ||||
| Thermocouple Profile D | 2001-01-03 | - | -0.02 | |||
| 2001-01-03 | - | -0.04 | ||||
| 2001-01-03 | - | -0.08 | ||||
| 2001-01-03 | - | -0.16 | ||||
| 2001-01-03 | - | -0.32 | ||||
| Water Level Floor | 2009-01-14 | - | -14.98 | 93.1 | 0 | |
| Water Level Road | 2018-05-11 | - | ||||
| Water Potential A | 2022-04-27 | - | ||||
| Weather Station | 2019-07-02 | 2021-08-11 |
Data Streams:
more data
| Code | First Day | Last Day | Description |
|---|---|---|---|
| TZ_amp | 2001-06-28 | - | Processed data and gap filling as submitted to Ameriflux. |
| TZ_co2prof | 2000-01-01 | - | Profile of CO2 concentration at four points on the tower. Originally from an LI-800 or LI-820 with samples pumped through solenoid controlled manifold. Starting 2018-02-07 a new system with independent Vaisala GMP343 CO2 sensors were installed at each location. |
| TZ_co2profcal | 2000-01-01 | 2016-11-26 | Automatic calibrations of the tower co2 profile |
| TZ_fdopen | 2017-10-25 | - | Soil CO2 flux from Forced Diffusion chamber near the soil co2 profile in the open grass area. |
| TZ_fdtree1 | 2017-10-18 | - | Forced diffusion chamber near the soil co2 profile under the first tree |
| TZ_Fenergy | 2010-07-16 | 2011-02-03 | Supplementary radiation and heat sensors on the ground in the open and under the trees installed in early summer of 2010 |
| TZ_fflux | 2001-01-05 | - | 30 minute flux data from the Floor tower at Tonzi from the winflux flx files. |
| TZ_fmet | 2001-01-05 | - | Soil temperature, soil heat flux, airT, RH and P from the area near to the gate in the tower cow fence |
| TZ_fprocessed | 2021-01-01 | - | Data from the Floor L1 processed data file |
| TZ_fprocessed3 | 2021-01-01 | - | Data from the FloorL3 processed data file |
| TZ_irt | 2015-05-06 | - | Surface temperatures from IRT sensors |
| TZ_mp | 2000-01-01 | - | Data from the Moisture Point probes at Tonzi. |
| TZ_osusp1 | 2012-01-09 | - | Oregon State Univ sensors at location SP1 near the soil co2 profiles. These sensors were installed in 2012 for the AirMOSS experiment and given to the Biometlab in summer 2018 |
| TZ_osusp2 | 2012-01-09 | - | Oregon State Univ sensors at location SP2 near the Tonzi Tower. These sensors were installed in 2012 for the AirMOSS experiment and given to the Biometlab in summer 2018 |
| TZ_osusp3 | 2012-01-09 | - | Oregon State Univ sensors at location SP3 to the southeast of the Tower. These sensors were installed in 2012 for the AirMOSS experiment and given to the Biometlab in summer 2018 |
| TZ_phenocam | 2011-10-26 | - | Camera data as processed by the Phenocam Project - undated infrequently. This includes a tree and grass ROI although the tree ROI is polluted by underlying grass especially in winter. |
| TZ_ptdendro | 2022-11-03 | - | Date from point dendrometers, original 5 are hourly measurements linear interpolated to 30min values |
| TZ_rwell | 2018-05-11 | - | Water level data from the eastern most well near the road. |
| TZ_sapE | 2000-01-01 | 2010-09-04 | Southest sap flow station on CR10x13 for cluster 5 and 6 trees and prgram C56 |
| TZ_sm | 2001-01-05 | - | Soil moisture from CR23X3 - seven Delta-T Theta Probes near the tower. |
| TZ_soilco2 | 2001-01-01 | 2022-08-05 | Soil CO2 profiles at -2, -4, -8, -16cm from soil surface in two locations one in the open the other near the base of a tree. Soil temperatures at the measument locations are also recorded. |
| TZ_soilvue | 2022-07-19 | - | Data from SoilVue C and soil water potential C installed near OSU SP1 |
| TZ_tflux | 2000-01-01 | - | Data from the 30 minute .flx files recorded by winflux for the above canpoy tower at Tonzi. |
| TZ_tmet | 2001-01-01 | - | Met data from instruments at the top of the tower. |
| TZ_tomst | 2024-03-07 | - | Date from TOMST point dendrometers, original data are 15min measurements only 30min values stored here |
| TZ_tprocessed | 2021-01-01 | - | Data from the TowerL1 processed data file |
| TZ_tprocessed3 | 2021-01-01 | - | Data from the TowerL3 processed data file |
| TZ_tram | 2000-01-01 | 2015-12-25 | One second PAR and net radiation from a moving tram car |
| TZ_well | 2007-05-23 | - | Data from the Global Water data logger in the Tonzi Floor well. GL data is instantaneous at arbitrary 30min intervals - these times are rounded to closest half hour when stored. Changed to Decagon CTD-10 well sensor on 2018-02-07 |
| TZ_windprof | 2003-08-01 | 2008-12-11 | Wind profile data from Handar 2D sonics on the Tower at heights 1 = 10.61m, 2 = 11.76m, 3 = 13.21m, 4 = 15.04m and 5 = 16.86m |
| TZ_zcam | 2009-05-13 | - | Data generated from JPEG images of the upward facing zenith cameras Tonzi |
Metadata and Data Sets:
more data
| Id | Type | Site | Dates | Frequency | Title | Description |
|---|---|---|---|---|---|---|
| 17 | Ground Penetrating Radar | TZ | 2011-05-03 - 2011-05-05 | Once | Ground Penetrating Radar by Naama | Ground Penetrating Radar by Naama. Six tree location were sampled using 8mx8m grids with 20cm line spacing. Two 100cm x 60cm pits were dug to bed rock at 0.5 and 1.5m from each main bole for calibration. For more details see: Raz-Yaseef, N., Koteen, L., Verfaillie, J., Baldocchi, D. (2013) Root system structure of a water limited oak savanna estimated with a ground penetrating radar. Journal of Geophysical Research, Biogeosciences. |
| 37 | LAI | TZ | 2022-07-19 - 2023-07-25 | Once or twice a year during summer | Optical LAI measured in-situ | 50+ measurements taken each time with a LAI-2200C. Most of the measurements were taken with the 2-wand method, where an "above" wand was set up on a tripod in the open area east of the Tonzi tower and took measurements every 5 sec, and a "below" wand was used to collect data below the tree canopy. The data were processed in the Licor software FV2200, where each "below" measurement was paired with the "above" measurement closest in time; LAI was calculated. Some files were corrected for scattering (based on 4A scattering data); scattering correction usually affected the LAI by <0.05. |
| 7 | Leaf Level | TZ | 2001-01-01 - 2008-12-31 | Mostly bi-weekly during the summer | Various leaf level measurements | Leaf level measurements from 2001 to 2008 compiled by Jessica Osuna. Measurements include A-Ci, A-RH, A-PAR, water potential, stable isotopes, sap flow, etc. This is mostly Tonzi data but also data from Russel Ranch, Oak Ridge and UMBS. Also includes DBH, grass height, LAI. This entry needs to be updated as this pile of data gets better organized. |
| 18 | Lidar | TZ | 2003-08-24 | Once | Lidar flight by Airborne1 | On August 24, 2003, laser altimetry data were acquired with Optech ALTM 2025, which recorded both first and last returns for each laser pulse. The scanning pattern was z-shape. The claimed vertical accuracy from the data provider is 18 cm with 95% confidence and the horizontal accuracy is 1/3000 of the flying height. The swath is ca. 300m and the flying altitude is ca. 500m. The footprint size is about 18 cm. The average posting density is 9.5 points per square meter, resulting in an average spot spacing of about 32 cm. To obtain such a high pulse density, the site was flown twice. UTM zone 10, NAD83 / NAVD88, meters, ascii Bald Earth (t e n z i) Extracted Features (t e n z i) 0.50m Grids (e n z) Model Keypoints (e n z) First Pulse all-shots (t e n z i) citation Chen, Q., D. Baldocchi, P. Gong, and M. Kelly (2006), Isolating individual trees in a savanna woodland using small footprint lidar data, Photogrammetric Engineering and Remote Sensing, 72(8), 923-932. |
| 19 | Lidar | TZ | 2009-04-20 | Once | Lidar flight by Airborne 1 Corporation | The LiDAR data were collected for the study area on April 20, 2009. The sensor recorded the first and last return pulses. The scanning pattern was z-shaped. The scanning angle was 15°, and the flying altitude was about 900 m, corresponding to a swath of about 500 m. The average horizontal GPS solution difference from two base stations was 10–15 cm. The vertical accuracy was −0.01 ± 0.05 m, based on the comparison of 819 test points and interpolated digital elevation model elevations. The footprint size was about 18 cm. The average posting density was 4.1 points per square meter, resulting in an average spot spacing of about 0.5 m. NAD83/NAVD88, UTM Zone 10, meters Last Pulse and First Pulse in LAS and XYZ formats Kobayashi, H.,Baldocchi, D.D., Ryu, Y., Chen, Q., Ma, S, Osuna, J., Ustin, S. 2011. Modeling Energy and Carbon Fluxes in a Heterogeneous Oak Woodland: A Three-Dimensional Approach. Agricultural and Forest Meteorology. 152:83-100 |
| 20 | Lidar | TZ | 2012-03-21 | Once | Terrestial Lidar by Martin Beland - no leaves | Approximately six locations were scanned resulting in a total of 36 individual scans. Control points are included to tie scans together. The VZ-400 terrestrial LiDAR instrument used at Tonzi emits laser pulses at a wavelength of 1550 nm and can cover 360â—¦azimuthally and from −40â—¦ to +60â—¦ in elevation angle. The instrument has three important features which are not common among other terrestrial LiDAR scanners: (1) it can perform scans rapidly at a speed of 122,000 measurements per second, (2) it offers the possibility of using specially designed targets to make multiple scan co-registration signiï¬cantly more efï¬cient when combined with the RiScan Pro software (Riegl inc., Austria), and (3) the instrument can record full-waveform data (i.e., all pulse echoes are recorded at a small temporal interval) but this comes at a cost in acquisition time. The diameter of the laser pulse when leaving the instrument is7 mm, and the pulse divergence is 0.3 mrad. The trees were scanned from a distance of about 10–12 m. At this distance, the pulse cross section diameter for the Riegl VZ-400 is about 1 cm. The overall plot area was scanned from six different locations. All leaf-off and leaf-on scans were carried out from the same positions using the same angular resolution of about 280 urad. Depending on the coverage area settings used, each scan took between 2 and 6 min to complete. As of 2019-06-05 the data is on the Synology file server in room 107 |
| 21 | Lidar | TZ | 2012-05-15 | Once | Terrestial Lidar by Martin Beland - leaves on | Approximately six locations were scanned resulting in a total of 36 individual scans. Control points are included to tie scans together. The VZ-400 terrestrial LiDAR instrument used at Tonzi emits laser pulses at a wavelength of 1550 nm and can cover 360â—¦azimuthally and from −40â—¦ to +60â—¦ in elevation angle. The instrument has three important features which are not common among other terrestrial LiDAR scanners: (1) it can perform scans rapidly at a speed of 122,000 measurements per second, (2) it offers the possibility of using specially designed targets to make multiple scan co-registration signiï¬cantly more efï¬cient when combined with the RiScan Pro software (Riegl inc., Austria), and (3) the instrument can record full-waveform data (i.e., all pulse echoes are recorded at a small temporal interval) but this comes at a cost in acquisition time. The diameter of the laser pulse when leaving the instrument is7 mm, and the pulse divergence is 0.3 mrad. The trees were scanned from a distance of about 10–12 m. At this distance, the pulse cross section diameter for the Riegl VZ-400 is about 1 cm. The overall plot area was scanned from six different locations. All leaf-off and leaf-on scans were carried out from the same positions using the same angular resolution of about 280 urad. Depending on the coverage area settings used, each scan took between 2 and 6 min to complete. As of 2019-06-05 the data is on the Synology file server in room 107 |
| 22 | Soil Moisture | TZ | 2011-05-10 - Present | houly approximately | COSMOS areal soil moisture | Soil moisture from the COSMOS project. The method involves measuring low-energy cosmic-ray neutrons above the ground, whose intensity is inversely correlated with soil water content and with water in any form above ground level (Note: the contributions from subsurface and surface waters are distinguishable). This non-contact technique is capable of measuring average soil water content over a footprint of 34 hectares (a circle with a radius of 330 m) and depths up to 50 cm (10-20cm for Tonzi). Neutron counts in two energy bands (fast, >1 keV; and thermal, <0.5 eV) are measured. |
| 23 | Soils | TZ | 2011-05-03 - 2012-05-04 | Once | Soil cores for C:N and root samples | Soils and roots were sampled near five trees and two clusters. 16 locations per site were sampled for roots with a 3.2cm corer in 10cm increment profiles to 60cm. 14 locations per site were sampled for C:N with a 3.2cm corer in 10cm increment profiles to 50cm. For more details see: Koteen, L. E., N. Raz-Yaseef, and D. D. Baldocchi (2014), Spatial heterogeneity of fine root biomass and soil carbon in a California oak savanna illuminates plant functional strategy across periods of high and low resource supply, Ecohydrology, doi: 10.1002/eco.1508 |
| 24 | Soils | TZ, VR | 2019-04-30 - 2019-04-30 | Once | Soil cores for C:N and microbial community | Soil samples were collected to be analyzed for soil moisture, bulk density, C:N, and microbial community. At each sampling location, soil samples were taken with a narrow corer at four depths: 0-10, 10-20, 20-30, 30-40 cm. At Vaira, samples were taken in six locations surrounding the tower site. At Tonzi, samples were taken in twelve locations in open locations and near trees. |
| 31 | Tree Survey | TZ | 2018-06-06 - 2018-06-08 | Once | Tree Survey By Miriam | The survey was a census of 14 circular plots, pseudo-randomly placed in the approximate eddy covariance tower flux footprint (within 500 m from the tower). Plot placement aimed to sample tree species (Quercus douglasii QUDO, Pinus sabiniana PISA) and sizes that were roughly representative of the entire footprint, according to a 2003 lidar survey (itself deemed insufficiently accurate for initialization). Eleven plots had a radius of 13 m and three had a radius of 20 m, for a total area censused of 9,610 m2. In each plot, we measured trees which were > 1.5 m tall. We recorded: geographical location (Trimble GeoXT 6000 with external antenna and ArcPad software, differentially corrected using base station data to an accuracy of <50 cm [75.07% of data], 0.5 - 1 m [17.71% of data], 1 - 2 m, [6.47 % of data], or 2 - 5 m [0.75% of data]), diameter at breast height (DBH), and height (Nikon Forestry Pro laser rangefinder; 3 point method; reported distance accuracy is ± 1 m at distances shorter than 300 m). |
| 32 | Tree Survey | TZ | 2018-06-08 | Once | Pines for tree rings cores by Miriam | 20 pines (Pinus sabiniana PISA) were measured and cored as part of Jackie Ho's undergrad thesis. We aimed for large trees but not so large that the borer couldn't get to the center. For relatively straight-standing trees and for trees on slopes (which have growth more likely to reflect water deficit). Locations are from a phone GPS, diameter at breast height (DBH), and height (Nikon Forestry Pro laser rangefinder; 3 point method; reported distance accuracy is ± 1 m at distances shorter than 300 m). |
| 33 | Tree Survey | TZ | 2019-12-16 | Once | DBH and crown size by Miriam and Ana | Measurements of 20 QUDO & 20 PISA crown diameters (in 2 directions, not necessarily perpendicular) and DBHs. The purpose of data collection was to get a general idea of DBH~crown diameter allometry, but note that these trees were chosen in an ad-hoc manner and were not a random sample. DBH measured with a tape; crown width measured by two people with a tape, looking up to position the ends of the tape appropriately. GPS points from a phone, IDOL alcatel, with the 'GPS coordinates' app. Measurements done 12/16/19. |
| 34 | Tree Survey | TZ | 2023-04-26 | Multi year | Partial survey of banded trees by Sophie and Megan | Sophie Ruehr and Megan Hur, 93 of the banded tress were measured and photographed, band increment and circumference. |
| 36 | Water Potential | TZ | 2001-03-01 - Present | Bi-weekly during green leaf season | Oak tree leaf water potential | Leaf water potential using a pressure bomb to force water out of sprigs of oak leaves (some pine too) have been measured by many different people over the years. Generally three trees have been used (102, 255 and 92 aka Liu Kang's tree) although some times the tree ids were not recorded (2010, 2011, 2012). Also young and old pine trees but again not always recorded. Usually small sprigs of multiple oak leave were cut from the tree in multiple (sunlit, shade, different height) locations and immediately measured. Midday is the most prevalent measurement time, but many predawn measurements were done, and occasionally multiple times throughout the day. Sometimes only qualitative times of "predawn" and "midday" were recorded these were assumed to be 30min before sunrise and solar noon. |
2005_TZ_AmerifluxReport.pdf - Ameriflux intercomparison from March 3-13, 2005 at Tonzi Tower
2010_TZ_AmerifluxReport.pdf - Ameriflux intercomparison from May 13-22, 2010 at Tonzi Tower
2016_TZ_AmerifluxReport.pdf - Ameriflux intercomparison from April 12-25, 2016 at Tonzi Tower
https://youtu.be/hXThS9avnAA - Drone footage of the Tonzi Tower by Chad Hanson during the setup of an Ameriflux inter-comparison.
https://youtu.be/hOYKBk8jMVI - Sara and Naama dragging Electro-Magnetic Induction (EMI) unit for spacial soil moisture.
ATI_Gill_compare_SI_WP_TT.pdf - An ATI orthogonal sonic was borrowed from the Goldstein Lab and intercompared with Gill sonics at Sherman Island, West Pond and Tonzi Ranch.
2016_TZ_AmerifluxStorageReport.pdf - Analysis of CO2 profile data from a 10 inlet profile system mounted on the Tonzi Tower in conjunction with the Ameriflux cross comparison.
https://youtu.be/rcZxd647afM - 2020 daily gap-filled Planet Labs imagery for Tonzi and Vaira
Tonzi Floor well sensor comparison
Tonzi Tower CO2 Profile
Initial OSU Soil Data
Tonzi Tree Survey by Miriam Johnston
Forced Diffusion Tonzi Vaira
Tree Survey by Miriam and Ana
Beginning and ending of green up of Tonzi oaks
Rotating Shadow Band
TZ adjustment to NDVI850_out
Sonic Comparison
Tonzi Tower Eddy System Compare
Tonzi Tower - NDVI (SRS, Planet)
Tonzi Floor swap to new RH-T