
Site: Gilbert Tract (GT) aka US-Dmg
2021-05-25 - Present
A new restored tidal freshwater wetland located on the west Delta, within Oakley, CA. The tower is located in the eastern side of the Gilbert Parcel seeing the mid marsh transition zone upwind. Restoration work is done by DWR and started in 2018, revegetation planting started in late 2019, followed by tidal action restoration in October 2021.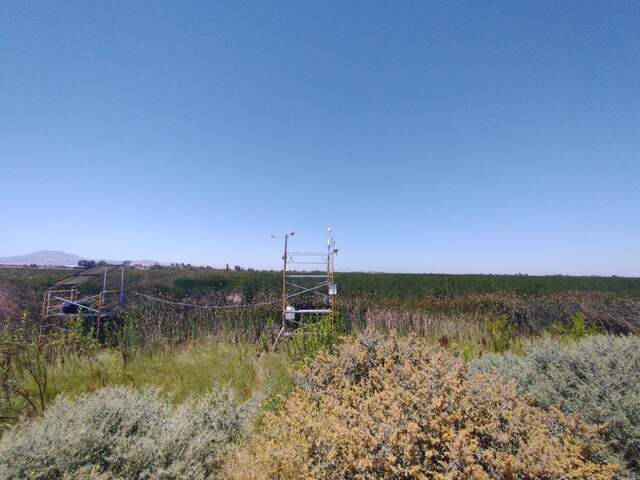
Last field site visit: more fieldnotes
| 2025-06-10 12:10:00 | All channel data okay, forgot phenocam images maybe, knocked down a couple wasp nests, replaced two boardwalk posts, Azolla is fully back and super green |
Latest data processing: more processing notes
| 2050-01-01 | ADCP processing for dates: 2050-01-01 - 2050-01-01 |
| Processor of record: 2022-02-22 - Ariane Arias-Ortiz 2024-01-10 - Joe Verfaillie |
Ameriflux Author:
00000000 - Dennis Baldocchi 20210901 - Ariane Arias-Ortiz |
Data Digital Object Identifier (DOI)
FLUXNET: https://doi.org/10.17190/AMF/2469451
AmeriFlux: https://doi.org/10.17190/AMF/1964086
Equipment Locations
more details
| Equipment | Start Date | End Date | X | Y | Z | Notes |
|---|---|---|---|---|---|---|
| Anemometer | 2021-09-02 | - | 0 | 0 | 5.62 | Heading=76 |
| Camera | 2021-09-02 | - | 1.84 | -1.83 | 5.79 | |
| CH4 Probe Channel | 2025-02-18 | - | Submerged and co-located with ADCP, EXO, MD | |||
| CH4 Probe Tower | 2025-01-15 | - | On float by staff gauge | |||
| CO2 Probe | 2021-09-09 | - | -3.58 | -2.25 | 0.05 | |
| Conductivity Sensor | 2021-09-09 | - | -3.58 | -2.25 | 0.05 | |
| Conductivity Sensor Channel | 2024-08-16 | - | Installed with EXO in Gilbert Tract channel | |||
| Data Logger Channel | 2024-08-15 | - | Installed for EXO3S | |||
| Data Logger Met | 2021-09-02 | - | 0.32 | -1.83 | 1.7 | |
| DO Sensor | 2021-09-09 | - | ||||
| DO Sensor Channel | 2022-05-06 | 2023-08-04 | Co-located with USGS ADCP in channel | |||
| 2024-01-18 | - | Mounted on back of ADCP | ||||
| EXO | 2024-08-16 | - | ||||
| fDOM | 2024-08-16 | - | ||||
| Flowmeter ADCP | 2022-02-18 | - | Near Gilbert tract breach | |||
| Gas Analyzer CH4 | 2021-09-02 | - | 0.32 | 0 | 5.52 | |
| Gas Analyzer CO2/H2O | 2021-09-02 | - | 0.17 | 0.15 | 5.62 | |
| Heat Flux Plate A | 2021-09-09 | - | -5.72 | -3.79 | -0.02 | |
| Heat Flux Plate B | 2021-09-09 | - | -4.68 | 1.99 | -0.02 | |
| Heat Flux Plate C | 2021-09-09 | - | -2.92 | -1.5 | -0.02 | |
| Interface LI-7550 | 2021-09-02 | - | 0.32 | -0.1 | 2 | |
| Multiplexer Met | 2021-09-02 | - | 0.32 | -1.83 | 1.5 | |
| Multiplexer Thermocouple | 2021-09-02 | - | 0.32 | -1.73 | 1.5 | |
| Narrow Band NDVI Incoming | 2021-09-02 | - | -1.58 | -2.23 | 4.58 | |
| Narrow Band NDVI Reflected | 2021-09-02 | - | -1.58 | -2.23 | 4.48 | |
| Narrow Band PRI Incoming | 2021-09-02 | - | -1.58 | -2.23 | 4.58 | |
| Narrow Band PRI Reflected | 2021-09-02 | - | -1.58 | -2.23 | 4.48 | |
| Net Radiometer 4-Way | 2021-09-02 | - | -2.02 | -2.13 | 4.53 | |
| PAR Sensor Diffuse | 2021-09-02 | - | 1.84 | -2.53 | 5.68 | |
| PAR Sensor Incoming | 2021-09-02 | - | -1.43 | -2.03 | 4.58 | |
| PAR Sensor Reflected | 2021-09-02 | - | -1.43 | -2.03 | 4.48 | |
| pH ORP | 2024-08-16 | - | ||||
| Precipitation | 2021-09-16 | - | 1.84 | 0.15 | 4.5 | |
| Range Finder | 2024-09-25 | - | Sonic water level, staff gauge post | |||
| RH & Temp | 2021-09-02 | - | 0.27 | 0.28 | 5.2 | |
| Solar Controller ADCP | 2022-02-18 | - | ||||
| Solar Panel ADCP | 2022-02-18 | - | ||||
| Thermocouple Profile A | 2021-09-09 | - | -5.42 | -3.79 | 0.45 | |
| 2021-09-09 | - | -5.42 | -3.79 | 0.3 | ||
| 2021-09-09 | - | -5.42 | -3.79 | 0.15 | ||
| 2021-09-09 | - | -5.42 | -3.79 | 0.05 | ||
| 2021-09-09 | - | -5.42 | -3.79 | 0 | ||
| 2021-09-09 | - | -5.42 | -3.79 | -0.02 | ||
| 2021-09-09 | - | -5.42 | -3.79 | -0.08 | ||
| 2021-09-09 | - | -5.42 | -3.79 | -0.16 | ||
| 2021-09-09 | - | -5.42 | -3.79 | -0.32 | ||
| Thermocouple Profile B | 2021-09-09 | - | -4.38 | 1.99 | 0.3 | |
| 2021-09-09 | - | -4.38 | 1.99 | 0.15 | ||
| 2021-09-09 | - | -4.38 | 1.99 | 0.05 | ||
| 2021-09-09 | - | -4.38 | 1.99 | 0 | ||
| 2021-09-09 | - | -4.38 | 1.99 | -0.02 | ||
| 2021-09-09 | - | -4.38 | 1.99 | -0.08 | ||
| 2021-09-09 | - | -4.38 | 1.99 | -0.16 | ||
| 2021-09-09 | - | -4.38 | 1.99 | -0.32 | ||
| Thermocouple Profile C | 2021-09-09 | - | -2.62 | -1.5 | 0.15 | |
| 2021-09-09 | - | -2.62 | -1.5 | 0.1 | ||
| 2021-09-09 | - | -2.62 | -1.5 | 0.05 | ||
| 2021-09-09 | - | -2.62 | -1.5 | 0 | ||
| 2021-09-09 | - | -2.62 | -1.5 | -0.02 | ||
| 2021-09-09 | - | -2.62 | -1.5 | -0.08 | ||
| 2021-09-09 | - | -2.62 | -1.5 | -0.16 | ||
| 2021-09-09 | - | -2.62 | -1.5 | -0.32 | ||
| Turbidity | 2024-08-16 | - | ||||
| Water Level | 2021-09-09 | - | -3.58 | -2.25 | -0.7 | In well |
| Water Level Boardwalk | 2021-12-15 | 2022-02-02 | Laying on ground | |||
| 2022-02-02 | 2022-02-18 | Moved to middle of 2nd boardwalk | ||||
| 2022-02-18 | 2022-05-20 | Moved to end of 2nd boardwalk - might float | ||||
| 2022-05-20 | 2022-10-19 | Moved to end of 3rd boardwalk | ||||
| 2022-10-19 | 2023-07-05 | Moved to post beyond boardwalk | ||||
| 2023-07-05 | 2023-11-28 | Cable pulled lifting sensor higher | ||||
| Weather Station | 2021-09-15 | - |
Data Streams:
more data
| Code | First Day | Last Day | Description |
|---|---|---|---|
| GT_adcp | 2022-02-18 | - | Data output from the side looking Acoustic Doppler Current Profiler (ADCP) in the channel near the Gilbert Tract Breech. |
| GT_adcpsnr | 2022-02-18 | - | Raw signal to noise ratios and cell velocities |
| GT_adcpvel | 2022-02-18 | - | Raw ADCP cell velocities |
| GT_arable | 2021-09-15 | - | Data from an Arable Mark I unit at GT. 60min averages only for now |
| GT_cam | 2021-09-02 | - | Digital number data from Phenocamera at Gilbert Tract Phenocam archive |
| GT_chanexo | 2021-05-25 | - | Water data from the EXO sonde (previously from the USGS EXO sonde, October 2021 through January 2023) |
| GT_flux | 2021-09-02 | - | 30min averages of the raw high frequency eddy data at Gilbert parcel in the Dutch Slough tidal restoration project |
| GT_mdchan | 2022-05-06 | - | Dissolved oxygen data from the PME minidot sensor deployed at Gilbert Tract channel |
| GT_met | 2021-09-02 | - | 30-minute averages of data from the met sensors at the Gilbert parcel on the Dutch Slough tidal wetland restoration project |
| GT_minidot | 2021-09-09 | - | Dissolved oxygen data from the PME minidot sensor |
| GT_nwisji | 2021-09-02 | - | Data from USGS 11313433 DUTCH SLOUGH BL JERSEY ISLAND by web service: https://waterservices.usgs.gov/rest/IV-Test-Tool.html Location: 38.0135326, -121.667731 |
| GT_processed | 2021-09-02 | - | Data loaded from the Level 1 processed data including fluxes and turbulence data |
| GT_processed3 | 2021-09-02 | - | Gap filled and partitioned data from Level 3 processing files |
Metadata and Data Sets:
more data
| Id | Type | Site | Dates | Frequency | Title | Description |
|---|---|---|---|---|---|---|
| 44 | Chamber fluxes | MB, GT, EL | 2023-12-06 - 2024-08-15 | Twice | CH4, N2O, CO2 chamber fluxes in wetlands | Part of Kuno's global quest to measure as many wetland chamber fluxes as possible. We used homemade dark floating chambers for most of the samples, although we also experimented with homemade clear floating chambers and the Smart Chamber if it was dry enough. We measured water quality parameters (temperature, pH, DO, conductivity, turbidity, ORP, WTD), took 10cm deep soil samples at some points, took dissolved gas samples from the water (December samples only), and recorded each point with GPS. |
| 43 | Chamber fluxes | GT | 2024-09-19 - 2024-10-23 | Weekly | CH4, CO2 chamber fluxes and thermocouple profiles during high/low tide | About 50m west of the tower, we installed three sets of thermocouple profiles (+5cm, 0cm, -2cm, -8cm) with an IRT. Two sets also had a miniDOT. Robert is interested in how these temperatures fluctuate during the tidal cycle in different parts of the wetland. Concurrently, Kuno took CH4 and CO2 fluxes using floating chambers and the LI-7810. He sampled on 6 days. 2024-09-19 – low tide 2024-09-24 – high tide 2024-10-05 – low tide 2024-10-09 – high tide 2024-10-16 – low tide 2024-10-23 – high tide See the field note from 2024-09-19 for more of the set-up details: https://biometlab.cnr.berkeley.edu/biometlab/bmetdata/fieldnotes.php?recno=4586 |
| 48 | Lidar | MB, EE, WP, GT | 2023-03-23 - 2023-03-25 | Once | Drone Lidar and 10-band imagery | On March 23rd to 25th, 2023, eTrac (a Woolpert Company) flew a drone with Lidar and 10 band imagery over Mayberry, East End and West Pond on Twitchell and Gilbert Tract at Dutch Slough. 34 flights at a height of 90m above ground level were flown. The drone was a DJI Matrice 600 Pro octocopter and it carried a Riegl MiniVUX-1 Laser Scanner and an Agrowing Sony Alpha a7R11 10-band camera. The Lidar resulted in 161-184 points per square meter with vertical standard deviation of about 2cm. Point clouds (LAS), Digital Terrain Maps (DTM) and Digital Elevation Maps (DEM) are available. The camera has the following bands: 405, 430, 450, 550, 560, 570, 650, 685, 710 and 850nm. The stitched imagery in geotiff format is available at the 1.5, 3, 15, 30cm and 1 and 3m resolutions. At the 1.5cm resolution there is only the full 10-band image. At the other resolutions RGB, grayscale NDVI and colorized NDVI are also available. The total data size on disk is 1.37TB. The three LAS files are about 5GB each, the stitched imagery is 207GB and the raw images are 1.14TB. |
| 47 | Lidar | MB, GT, EE, WP | 2023-08-02 - 2023-08-04 | Once | Drone Lidar and 10-band imagery | On August 2nd to 4th, 2023, eTrac (a Woolpert Company) flew a drone with Lidar and 10 band imagery over Mayberry, East End and West Pond on Twitchell and Gilbert Tract at Dutch Slough. 34 flights at a height of 90m above ground level were flown. The drone was a DJI Matrice 600 Pro octocopter and it carried a Riegl MiniVUX-1 Laser Scanner and an Agrowing Sony Alpha a7R11 10-band camera. The Lidar resulted in 184-216 points per square meter with vertical standard deviation of about 2cm. Point clouds (LAS), Digital Terrain Maps (DTM) and Digital Elevation Maps (DEM) are available. The camera has the following bands: 405, 430, 450, 550, 560, 570, 650, 685, 710 and 850nm. The stitched imagery in geotiff format is available at the 1.5, 3, 15, 30cm and 1 and 3m resolutions. At the 1.5cm resolution there is only the full 10-band image. At the other resolutions RGB, grayscale NDVI and colorized NDVI are also available. The total data size on disk is 765GB. The three LAS files are about 5GB each, the stitched imagery is 205GB and the raw images are 545GB. |
| 46 | Soils | GT | 2022-02-18 - 2022-02-18 | Once | Impounded marsh soil core for charcoal | Ari and Oscar Ticas extracted a 1m peat soil core from an impounded area of Dutch Slough (northern end of Gilbert Tract). The core was sliced vertically into 2 cm samples. 1 cc from each slice was analyzed for dry bulk density, organic matter (loss on ignition method), water content, and charcoal count. This project was for Oscar's senior thesis. |
https://youtu.be/77AkPfuQ_hg - Video of the newly created levee breach at Gilbert Tract to make the wetland tidal.
https://youtu.be/2-EvJwivrEU - Time lapse of Phenocam images showing the beginning of tidal action at Gilbert Tract.
GT Water Level Comparison and Correction