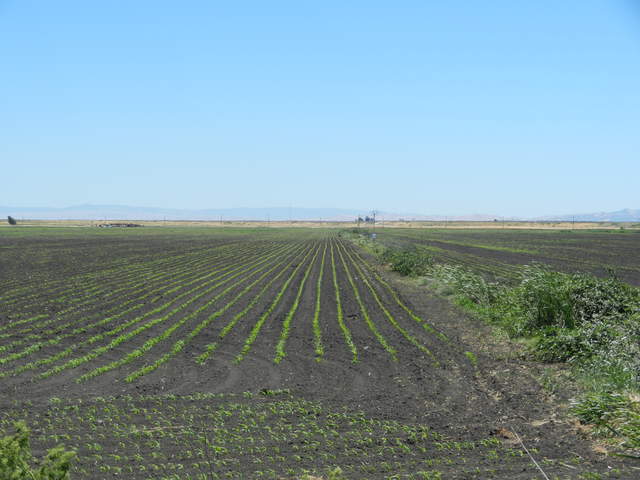
Site: DWR Corn (DC) aka US-Tw2
2012-05-21 - 2013-11-25
The Twitchell Corn site is a corn field on peat soil. The tower was installed on May 17, 2012 and was equipped to analyze energy, H2O and CO2 fluxes. The field was planted in early May 2012 and harvested in early November 2012. The field was fallow during the non-growing season. The variety of corn used was ES-7477 hybrid corn commercialized by Eureka seeds. Beginning 2013-05-09 this site was converted to wetland. The tower was moved 540m ESE to avoid earth moving in the construction. The site is near US-Tw1, US-Tw3 and US-Twt sites.
Last field site visit: more fieldnotes
| 2013-11-21 12:00:00 | Berms soft and muddy - no driving allowed. Tower got a bath. All good. |
Latest data processing: more processing notes
| 2013-11-20 | Processed: Met, L1, L2, L3 for dates: 2013-10-01 - 2013-11-16 |
| Processor of record: 2012-12-11 - Unknown 2013-05-30 - Sara Knox 2013-06-24 - Laurie Koteen 2013-07-29 - Cove Sturtevant 2013-08-08 - Laurie Koteen 2013-08-12 - Sara Knox 2013-08-20 - Laurie Koteen 2013-11-20 - Joe Verfaillie |
Ameriflux Author:
20120521 - Cove Sturtevant 20120521 - Joseph Verfaillie 20120521 - Dennis Baldocchi |
Data Digital Object Identifier (DOI)
FLUXNET: https://doi.org/10.17190/AMF/1881593
AmeriFlux: https://doi.org/10.17190/AMF/1246148
FLUXNET2015: https://doi.org/10.18140/FLX/1440109
Equipment Locations
more details
| Equipment | Start Date | End Date | X | Y | Z | Notes |
|---|---|---|---|---|---|---|
| Anemometer | 2012-05-21 | 2013-05-09 | -0.42 | -1.25 | 5.17 | |
| 2012-06-21 | 2013-05-09 | -0.26 | 0.26 | 5.17 | Moved to NW corner of scaffolding to avoid updraft from solar panels | |
| Camera | 2012-06-15 | 2013-05-09 | 1.45 | 0.15 | 5.07 | |
| Gas Analyzer CO2/H2O | 2012-05-21 | 2012-06-21 | 0.01 | -1.3 | 5.17 | |
| 2012-06-21 | 2013-05-09 | 0.17 | 0.21 | 517 | Moved to NW corner of scaffolding to avoid updraft from solar panels | |
| Heat Flux Plate A | 2012-05-31 | 2012-10-25 | -6.57 | -0.01 | ||
| Heat Flux Plate B | 2012-05-31 | 2012-10-25 | -0.02 | |||
| Heat Flux Plate C | 2012-05-31 | 2012-10-25 | ||||
| Interface LI-7550 | 2012-05-21 | 2012-08-02 | -0.06 | -1.52 | 3.67 | |
| 2012-08-02 | 2013-05-09 | 0.1 | -0.01 | 3.67 | Moved to NW corner of scaffolding | |
| Net Radiometer | 2012-05-21 | 2012-06-21 | -0.75 | 0.03 | 4.44 | |
| 2012-06-21 | 2013-05-09 | 4.84 | -0.46 | 4.54 | Moved to new boom to the east of the NE corner of the scaffolding | |
| PAR Sensor Incoming | 2012-05-21 | 2012-06-21 | -0.31 | -0.02 | 4.49 | |
| 2012-06-21 | 2013-05-09 | 4.6 | -0.43 | 4.59 | Moved to new boom to the east of the NE corner of the scaffolding | |
| PAR Sensor Outgoing | 2012-05-21 | 2012-06-21 | -0.31 | -0.02 | 4.39 | |
| 2012-06-21 | 2013-05-09 | 4.6 | -0.43 | 4.49 | Moved to new boom to the east of the NE corner of the scaffolding | |
| Precipitation | 2012-05-21 | 2012-06-21 | -0.15 | 0.02 | 4.54 | |
| 2012-08-02 | 2013-05-09 | -0.31 | -1.5 | 4.54 | Moved to SW corner of scaffolding after sitting unmounted for 5-6 weeks | |
| RH & Temp | 2012-05-21 | 2012-06-21 | 0.16 | -1.31 | 4.8 | |
| 2012-06-21 | 2013-05-09 | 0.32 | 0.2 | 4.8 | Moved to NW corner of scaffolding to avoid updraft from solar panels | |
| Soil Moisture Probe A | 2012-05-31 | 2012-10-25 | -6.35 | 0.16 | ||
| Soil Moisture Probe B | 2012-05-31 | 2012-10-25 | -0.02 | |||
| Soil Moisture Probe C | 2012-05-31 | 2012-10-25 | ||||
| Solar Panel A | 2012-05-21 | 2013-05-09 | 0.12 | -2.08 | 1.31 | |
| 2012-05-21 | 2013-05-09 | 0.12 | -2.08 | 1.31 | ||
| Solar Panel B | 2012-05-21 | 2013-05-09 | 0.78 | -2.15 | 1.31 | |
| 2012-05-21 | 2013-05-09 | 0.78 | -2.15 | 1.31 | ||
| Thermocouple A | 2012-05-31 | 2012-10-25 | -3.73 | -0.11 | -0.32 | |
| 2012-05-31 | 2012-10-25 | -3.73 | -0.11 | -0.16 | ||
| 2012-05-31 | 2012-10-25 | -3.73 | -0.11 | -0.08 | ||
| 2012-05-31 | 2012-10-25 | -3.73 | -0.11 | -0.04 | ||
| 2012-05-31 | 2012-10-25 | -3.73 | -0.11 | -0.02 | ||
| Thermocouple B | 2012-05-31 | 2012-10-25 | -3.98 | 4.92 | -0.32 | |
| 2012-05-31 | 2012-10-25 | -3.98 | 4.92 | -0.16 | ||
| 2012-05-31 | 2012-10-25 | -3.98 | 4.92 | -0.08 | ||
| 2012-05-31 | 2012-10-25 | -3.98 | 4.92 | -0.04 | ||
| 2012-05-31 | 2012-10-25 | -3.98 | 4.92 | -0.02 | ||
| Thermocouple C | 2012-05-31 | 2012-10-25 | -4.92 | -3.99 | -0.32 | |
| 2012-05-31 | 2012-10-25 | -4.92 | -3.99 | -0.16 | ||
| 2012-05-31 | 2012-10-25 | -4.92 | -3.99 | -0.08 | ||
| 2012-05-31 | 2012-10-25 | -4.92 | -3.99 | -0.04 | ||
| 2012-05-31 | 2012-10-25 | -4.92 | -3.99 | -0.02 | ||
| Water Level | 2012-05-31 | 2012-10-25 | -3.31 | -0.15 |
Data Streams:
more data
| Code | First Day | Last Day | Description |
|---|---|---|---|
| DC_flux | 2012-05-21 | 2013-11-25 | 3o minute averages of the 10Hz flux data. |
| DC_met | 2012-05-21 | 2013-11-25 | Micormet data collected by a CR1000 for the DWR Corn field. |
Metadata and Data Sets:
more data
| Id | Type | Site | Dates | Frequency | Title | Description |
|---|
cal_FR-Eosense_FDClassic_snFDC-11-13-006_20131206.pdf - 2013-12-06


