Reports
Contents
| Title: | Mayberry porewater sippers | ||||||||||||||||||||||||||||||||||||||||||||||||||||||||||||||||||||||
| Date: | 2023-05-09 - 2024-10-11 | ||||||||||||||||||||||||||||||||||||||||||||||||||||||||||||||||||||||
| Data File: | MB_salinity.csv MB_towercond_20230509_20241023.csv |
||||||||||||||||||||||||||||||||||||||||||||||||||||||||||||||||||||||
| Refers to: | MB, 7157, JC03148 | ||||||||||||||||||||||||||||||||||||||||||||||||||||||||||||||||||||||
|
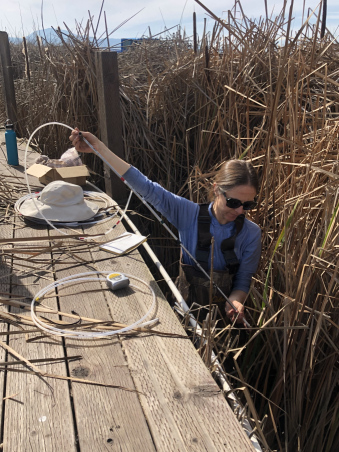
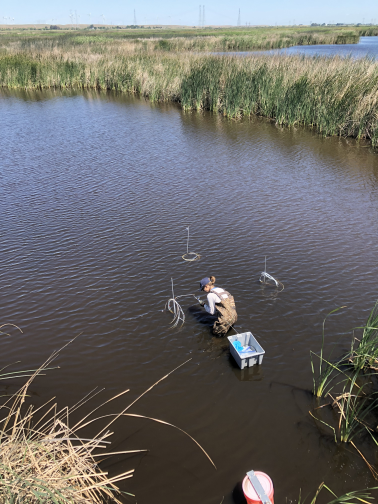
Kyle Delwiche installed various sipper profiles at Mayberry to measure porewater salinity. All profiles had depths 10cm, 20cm, 30cm, 40cm, and 50cm below the soil surface. Porewater samples were drawn out with a syringe (with the first 10ml drawn discarded) and temperature-compensated conductivity was measured with our handheld conductivity meter, YSI EC300A sn JC03148. From 2023-05-09 to 2024-01-30, there was one profile installed in the tules by the boardwalk, maybe 1m south of the tower. This is the same location as the later Veg-black profile that was installed. The different depths were color coded. We measured the depth when it was installed and when it was removed. We used the removal depth for analysis. The order of the blue and yellow sippers did not seem consistent between installation and removal, so we used the removal depth for analysis. Color, Install depth, Removal depth Bare, 10cm, 12cm Red, 20cm, 19cm Blue, 30cm, 40cm Yellow, 40cm, 22cm Green, 50cm, 48cm On 2024-02-12, three "vegetated" profiles were installed in the tules by the boardwalk. Data is labeled LOC-PROFILE-DEPTH. Blue profile – under radiometer boom on west side of tower Yellow depth - 10cm On 2024-04-23 and 2024-04-25, Kyle installed a total of three sipper profiles in the open water of the channel, just north of the tower. These profiles are also named Red, Blue, and Black, but I don't know the detailed position. They were within 2m of each other. The depth colors are the same as the vegetated sippers.
(L) Kyle installing the "black" profile of sippers among the vegetation (2024-02-12) (R) Kyle sampling "open water" sippers (2024-05-07)
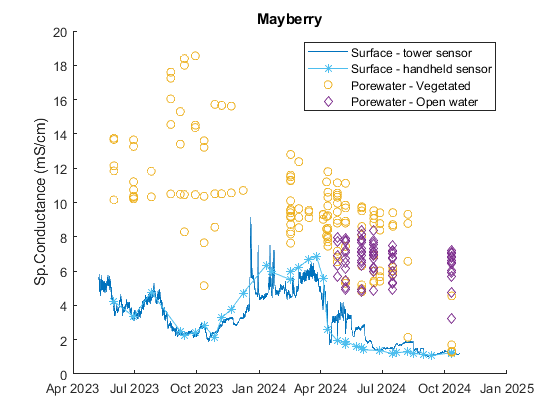
Fig 1. Timeseries of surface and porewater conductivity. The conductivity data from the continuous tower sensor (dark blue, Campbell CS547A sn 7157), which matches well with our handheld sensor (light blue). The vegetated samples had much higher conductivity in summer 2023 than summer 2024, not sure why.
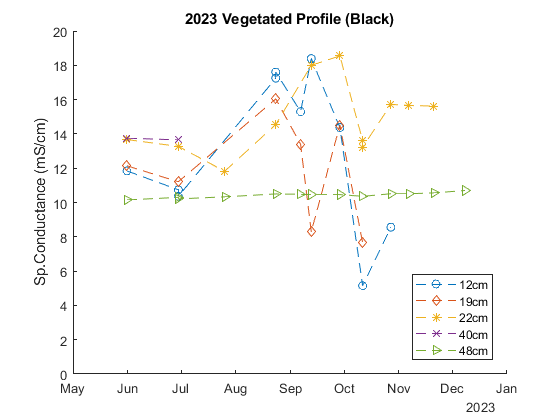
Fig 2. Timeseries of conductivity from the only 2023 porewater profile, in the vegetated-black location. The deepest depth stayed impressively consistent through the season. Most other depths reached their peak conductivity in Aug/Sept before decreasing again in October.
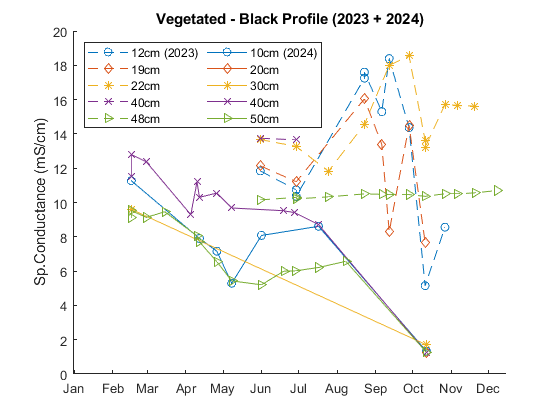
Fig 3. Timeseries of vegetated-black porewater conductivity in 2023 and 2024. 2023 data is in dashed lines and 2024 data is in solid lines. 2023 data was generally more saline than 2024. In 2023 we started measuring in May and saw a slight increase in August/September before conductivities decreased in October. In 2024 we started measuring in Feb and saw a slight increase in June/August. I'm curious if the GPP peak had different timing in 2023 and 2024.
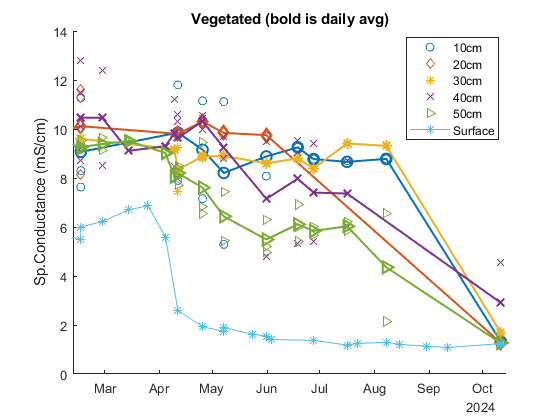
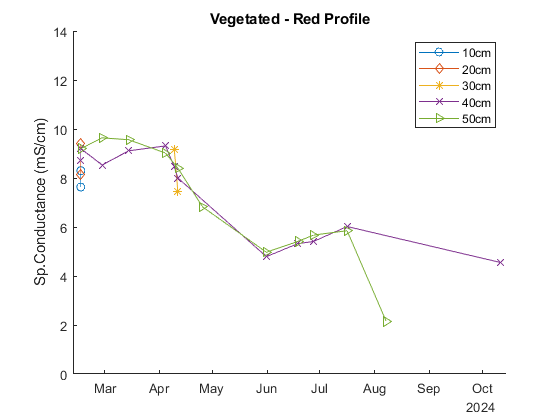
Fig 4. Timeseries of porewater conductivity from all of the vegetated sippers in 2024. The bold lines are the daily averages from each depth across all 3 profiles. The "vegetated" sippers started the growing season around 8-12 mS/cm. The top 3 depths (10-30cm) stayed at similar conductivity, while the bottom 2 depths (40-50cm) decreased to 6-10 mS/cm. So the deeper depths (outside of the rooting zone?) seem to be getting slightly fresher (and more similar to the "open water" sippers) through the growing season. On our most recent sampling on 2024-10-11, the "vegetated" sippers were much more similar to surface water, but I'm not sure I would trust the" vegetated" data on that date. Joe and I had disturbed all of the "vegetated" sippers in late September when we were upgrading the Mayberry scaffolding. We only sampled 6 of the possible 15 sippers, mostly from one profile (black).
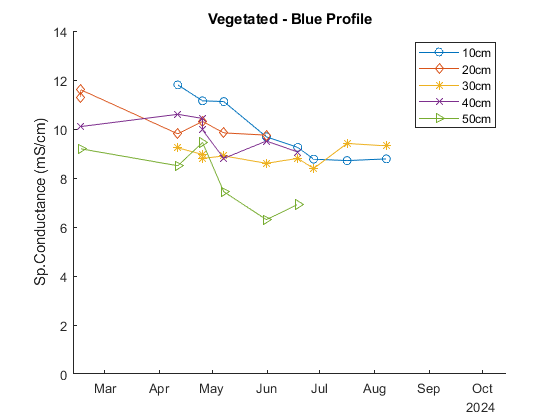
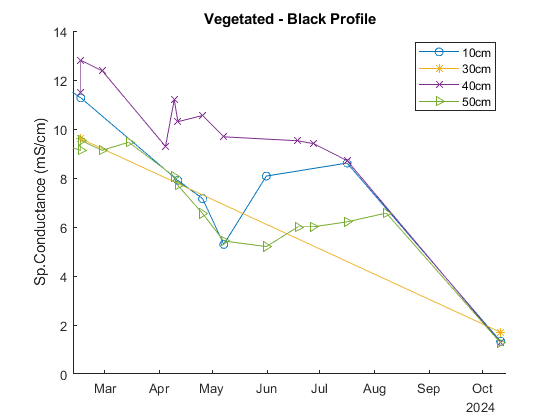
Fig 5. Timeseries of porewater conductivity from the individual sipper profiles in the vegetation. Each profile is among the reeds by the tower, within 2m of each other. The black and red profiles seem to be decreasing overall throughout the season, although there might be a slight increase Jun-August. The pattern in the blue profile is less clear. Although the different profiles start in different conductivity ranges, all depths generally have a lower conductivity by mid-August (except for 30cm (yellow) in the Blue profile).
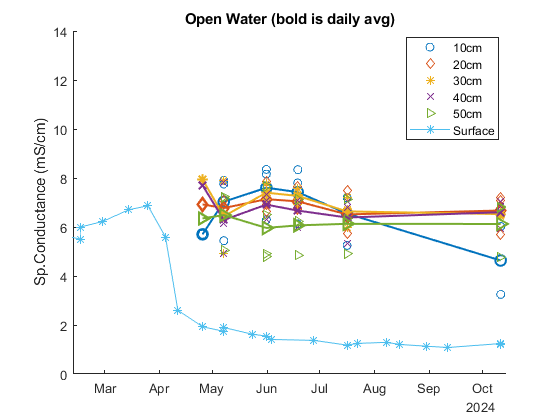
Fig 6. Timeseries of porewater conductivity from the open water sippers in 2024. In general the "open water" sippers stayed pretty consistent at 6-8 mS/cm.
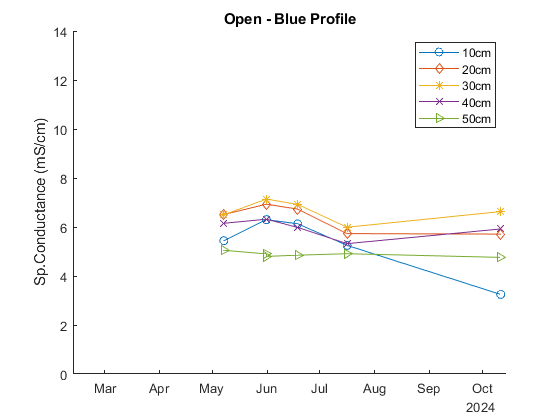
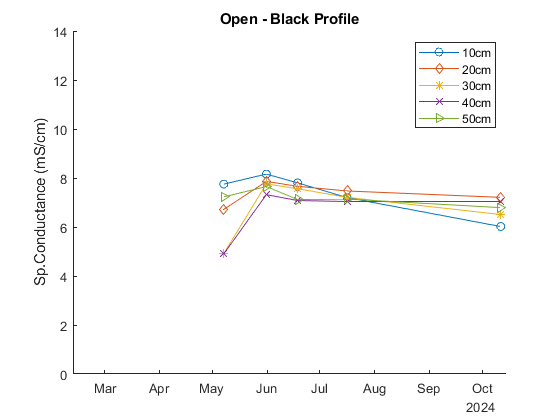
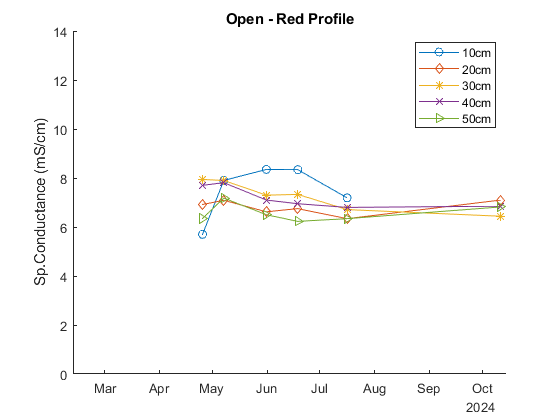
Fig 7. Timeseries of porewater conductivity from the individual sipper profiles in the open water. The three profiles are in the same range and the depths usually stay consistent throughout the season. There might be a slight increase in the 10cm depth (blue) in May/June before decreasing again.
~*~ SuPpLeMeNtAl InFoRmAtIoN ~*~
|
|||||||||||||||||||||||||||||||||||||||||||||||||||||||||||||||||||||||
| |


