Reports
Contents
| Title: | Zcam gap fraction at Bouldin Sorghum - 2024 |
| Date: | 2021-05-30 - 2022-08-15 |
| Data File: | BC_DailyGCCNDVI_2024.csv BC_DailyZcam_2024.csv |
| Refers to: | BC |
|
2024 - Sorghum planted in field for first time. The field was previously corn since at least 2018. Approximate planting date - Approximate date sprouts were first seen - No water in the well at all this season. Maybe a reason to plant sorghum is that they need less irrigation? I analyzed 8 times per day, 4 from dawn and 4 from dusk: 04:45, 05:15, 05:45, 06:15, 17:45, 18:15, 18:45, and 19:15. The sorghum plants shed a lot more pollen/dust than the corn plants, so the zcam lenses got dirty and had to be cleaned several times over the growing season. The lenses were sticky and gritty before cleaning. The lenses were cleaned on 2024-07-17 and 2024-08-07, so there might have been some noise before those days.
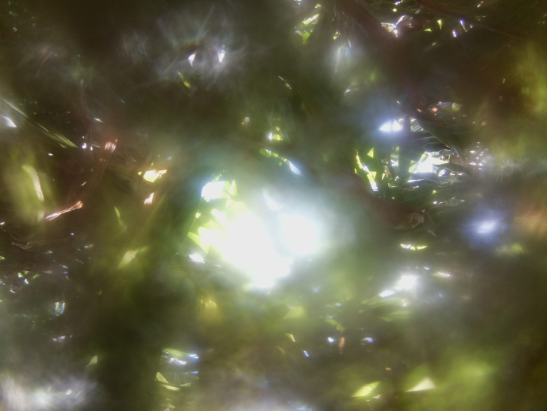
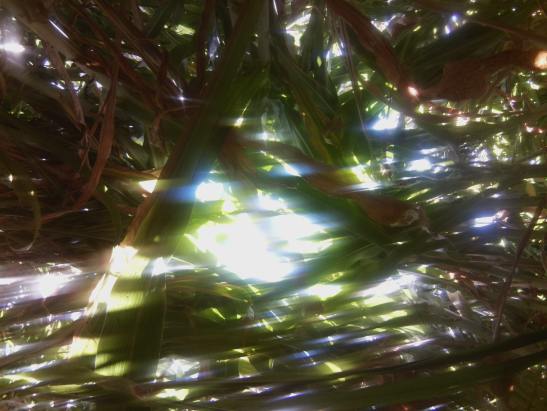
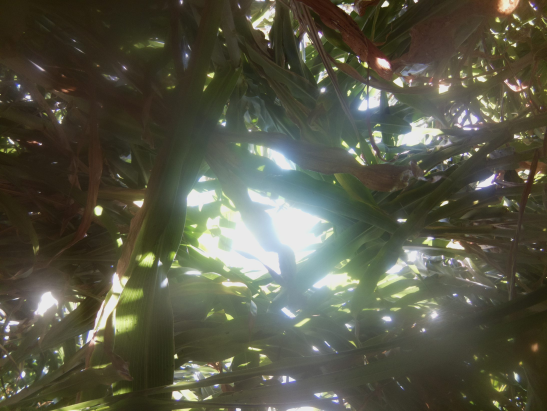
(L) Foggy view from zcam1 before cleaning (2024-08-07 11:15). (M) Streaky view from zcam1 after cleaning (2024-08-07 11:45), and it remained streaky the whole day. (R) Clear view from zcam1 one day after cleaning, maybe the overnight condensation/evaporation cleaned up the streaks (2024-08-08 11:45).
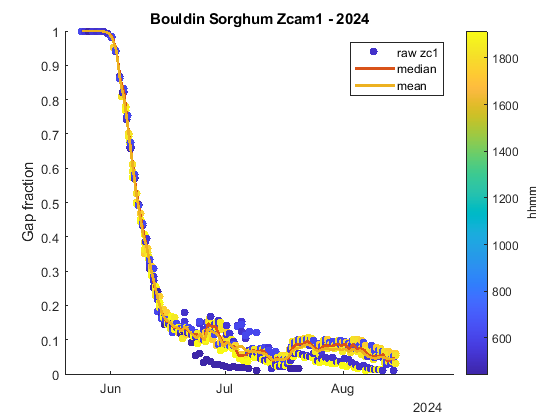
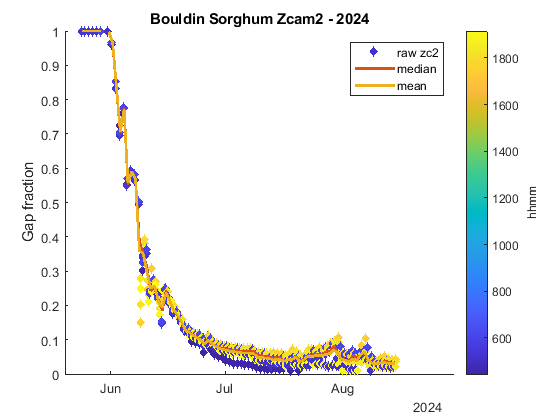
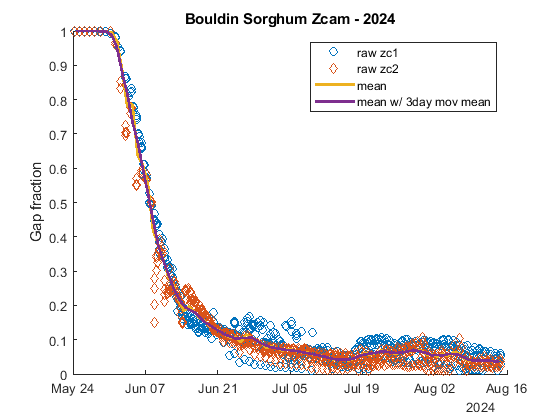
(L) Timeseries of gap fraction from zcam1. Color bar represents hh:mm of reading. (R) Timeseries of gap fraction from zcam2. Some jaggedness in early June.
About 8 daily values of from each camera were averaged together. Not all days had a complete set of 8 values because later in the season, the 4:45 and 19:15 values were too dark to be analyzed. The daily values were each camera were averaged together. Then those averages were averaged again to create a daily zcam gap fraction. I tried putting a 3-day moving mean through the daily zcam value, but there isn't much difference. I'll just save the daily value for now, and others can put a moving mean through it if needed for further analysis.
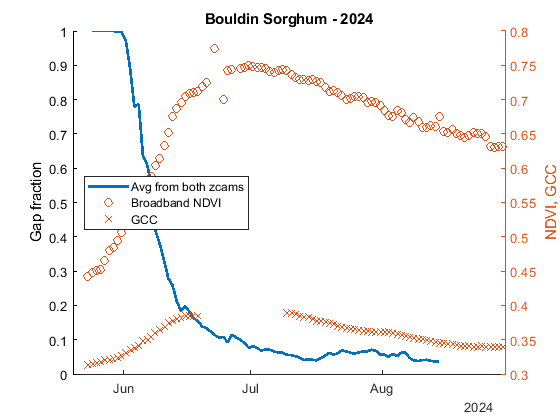
Daily zcam gap fraction is plotted in blue. Midday average bbNDVI and GCC are plotted with orange symbols. Unfortunately our Stardot Camera/CR1000 lost their connection for 2 weeks right in the middle of the growing season. Peak NDVI is around the same time that canopy finishes filling in.
|
|
| |


