Reports
Contents
| Title: | Zcam gap fraction at Bouldin Corn - 2021, 2022, 2023 | |||||||||||||||||||||||
| Date: | 2021-05-30 - 2022-08-15 | |||||||||||||||||||||||
| Data File: | BC_zcam_2021.csv BC_zcam_2022.csv BC_DailyGCCNDVI_2023.csv BC_DailyZcam_2023.csv |
|||||||||||||||||||||||
| Refers to: | BC | |||||||||||||||||||||||
|
2021 Corn was planted around 2021-05-03 (DOY123) and small sprouts were seen a week later on 2021-05-10 (DOY130). The zcam data starts around 3 weeks later at the end of May. Corn was harvested in mid October.
Figure 1.
Figure 2.
Figure 3.
Figure 4.
2022 Corn was planted around 2021-05-07 (DOY127) and small sprouts were seen about a week later.
Figure 5.
Figure 6.
Figure 7.
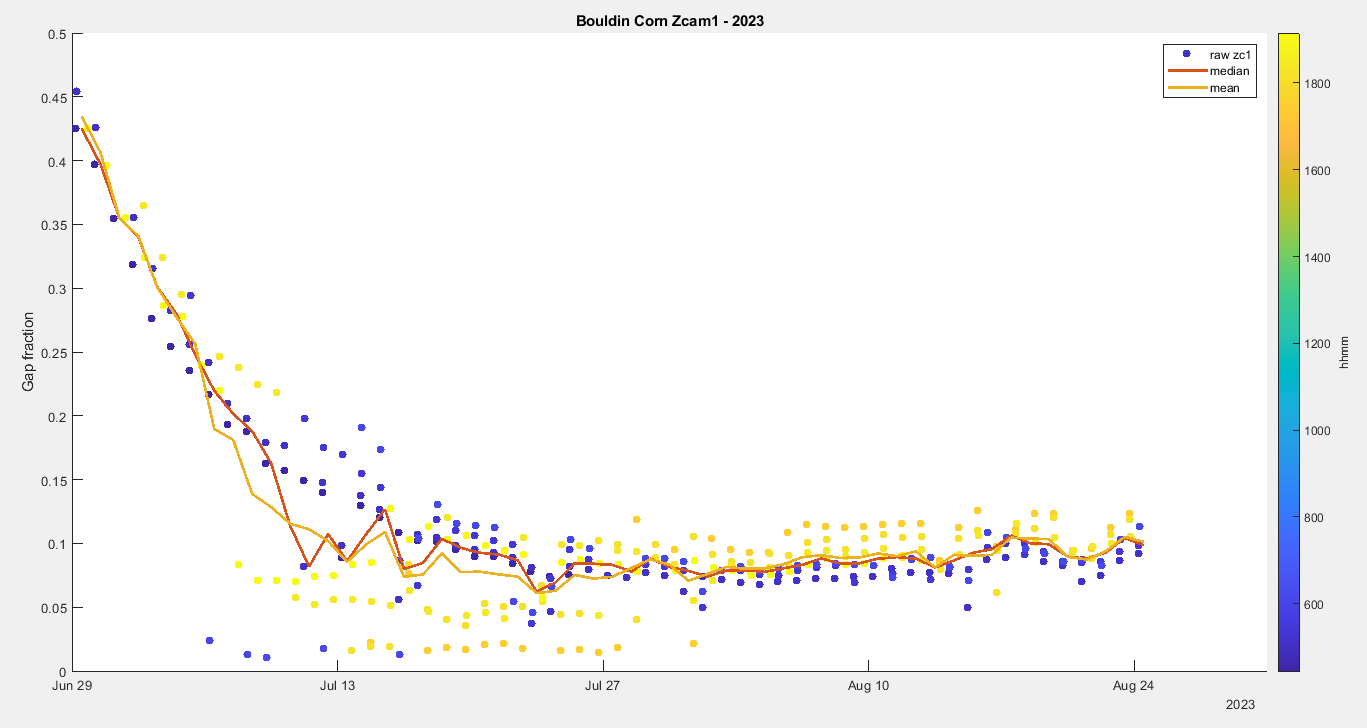
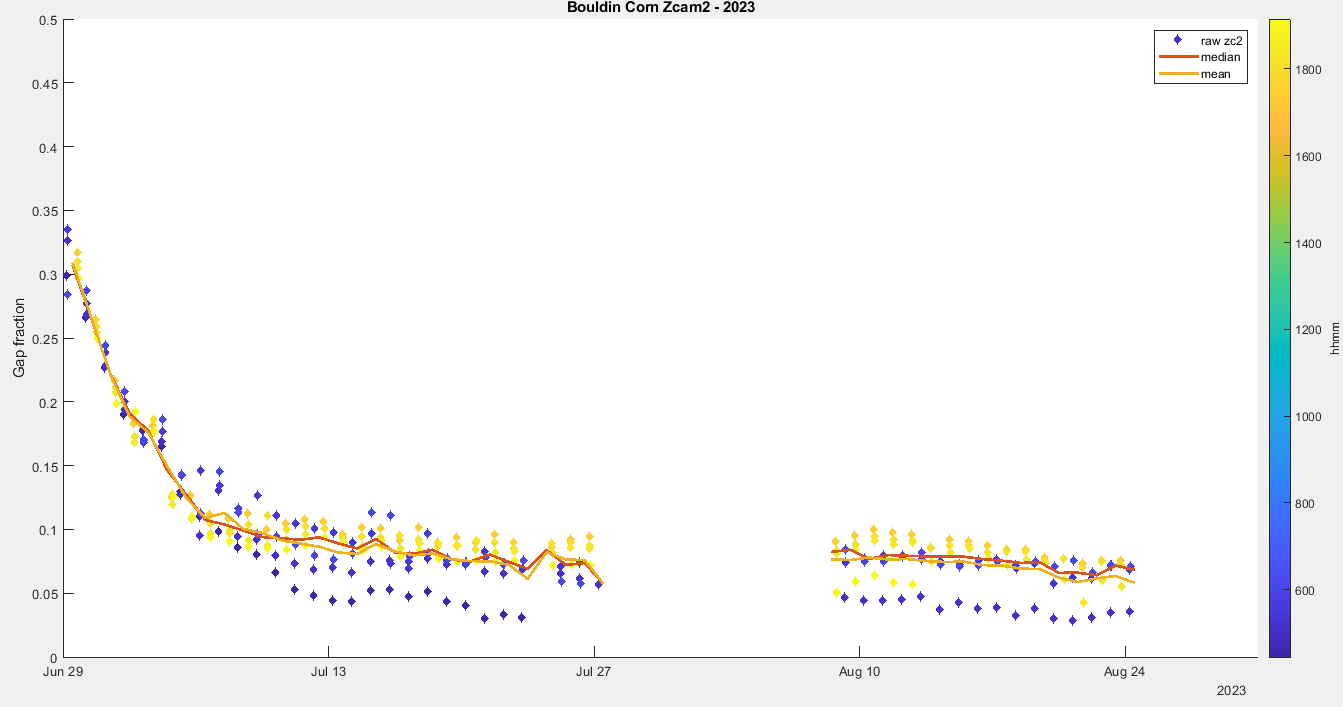
2023 I analyzed 8 times per day, 4 from dawn and 4 from dusk: 04:45, 05:15, 05:45, 06:15, 17:45, 18:15, 18:45, and 19:15. The color bar on the right represents hhmm of each point.
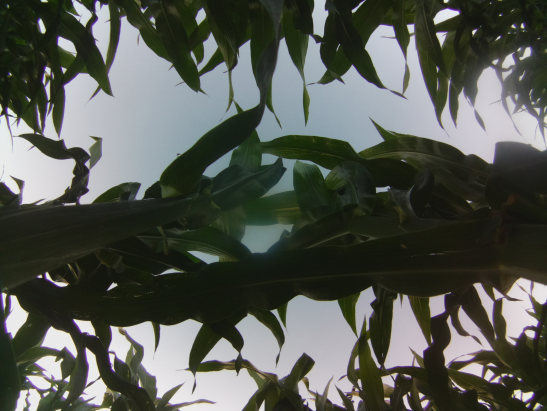
ZC1 starts the growing season with a gap fraction around 0.45, while ZC2 starts the season with a lower gap fraction around 0.35. ZC1 is placed in between corn rows while ZC2 is place inline with the corn rows, so ZC1 has more sky in its view. However by the end of July when the canopy is pretty much filled in, ZC1 and ZC2 have similar gap fraction values. The color balance on ZC1s purple-ish, but that probably doesn't affect the light vs. dark separation in the script that calculation gap fraction from zcams.
Figure: (L) Photo from ZC1, 2023-06-39 04:45. (R) Photo from ZC2, 2023-06-39 04:45.
Figure: Timeseries of gap fraction calculated from Zcam 1. Purple symbols are from dawn photos, and yellow symbols are from dusk photos. There's some noise throughout July. I'm not sure why. Mean and median differ slightly when it's noisier in July, but are overall pretty similar.
Figure: Timeseries of gap fraction calculated from Zcam 2. Purple symbols are from dawn photos, and yellow symbols are from dusk photos. Daily mean and median are very similar through the whole time series. There's a 11 days of data missing when the camera lost its clock, but by that time the canopy has pretty much finished filling in, so we're not losing much information about canopy development.
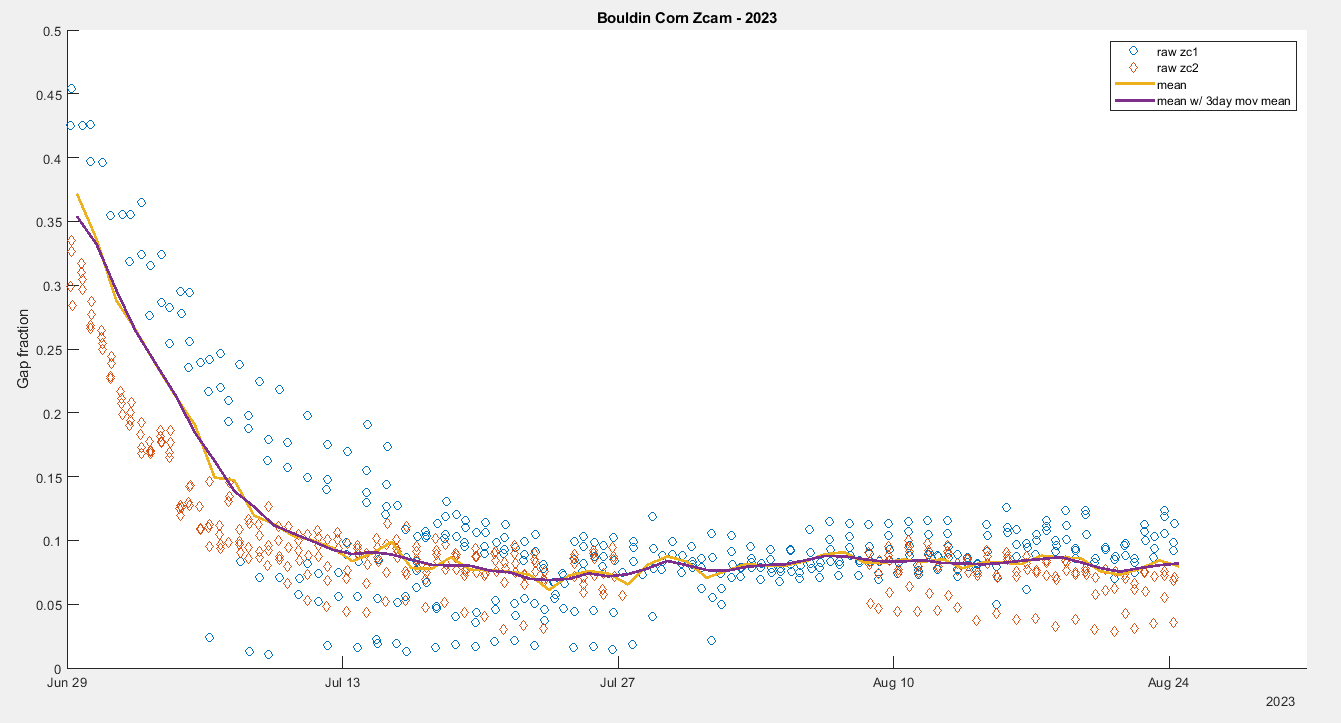
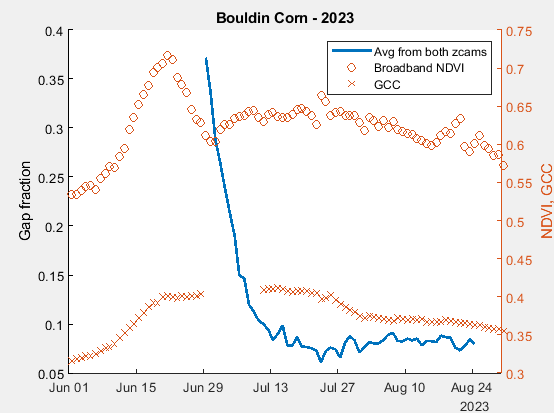
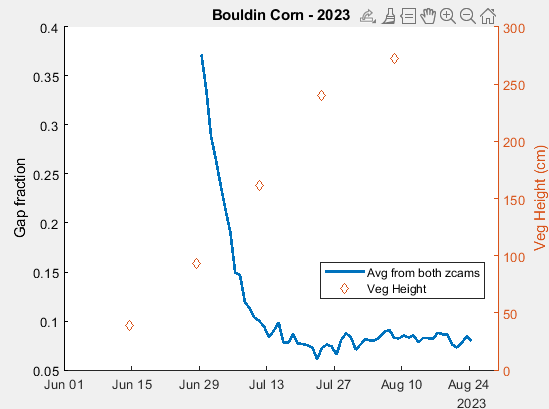
I took the daily average from each camera to calculate an overall daily average value for gap fraction. I also tried a 3-day running mean, but it doesn't make a big difference.
Figure: Timeseries of raw gap fraction calculated from each zcam and the daily average zcam from both cameras. Not much difference between the daily average and the 3-day moving mean of the daily average.
Broadband NDVI: Data from datafetch, daily averages using 11:00 to 14:00, inclusive (8 points) GCC: Data from datafetch, daily averages using 11:15 to 14:15 inclusive (7 points total) Vegetation height: Data from field measurements using tape measure, measured 10-15 plants during each site visit
|
||||||||||||||||||||||||
| |


