
Reports
Can't get there from hereContents
| Title: | HMP intercomparison - BA 11/2021 | ||||||||||||||||||||||||||||||||||||||||||||||||||||||||||||||||||||||||
| Date: | 2021-11-04 - 2021-11-18 | ||||||||||||||||||||||||||||||||||||||||||||||||||||||||||||||||||||||||
| Data File: | BA_HMPcomp_20211214.csv BA_HMPcomp_atmos14_20211214.csv |
||||||||||||||||||||||||||||||||||||||||||||||||||||||||||||||||||||||||
| Refers to: | BA,T2930114,T2820183,T2820180,S3420870,T1250012,U3030041 | ||||||||||||||||||||||||||||||||||||||||||||||||||||||||||||||||||||||||
|
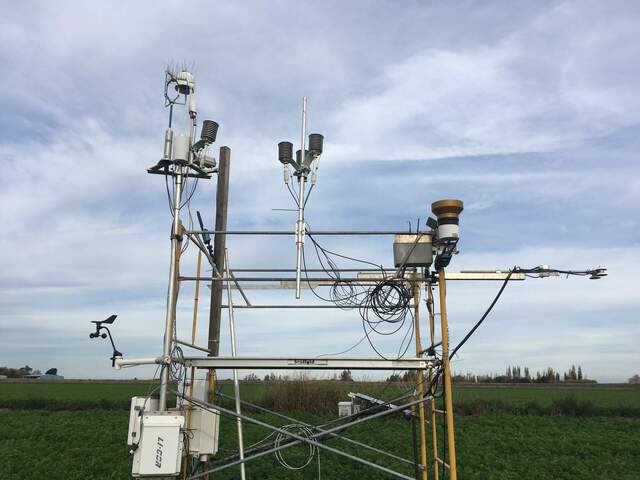
For 6 weeks in November and December 2021, we ran an HMP intercomparison at Bouldin Alfalfa. We compared several HMP155s, HMP45s, and 1 ATMOS14 sensor with the reference sensor, the HMP155 on the main tower. We first compared the 3 HMP155s with the tower reference sensor from 2021-11-04 to 2021-11-14. The three sensors were mounted on the west side of the scaffolding, at about the same height as the tower sensor. The tower sensor was at 353cm agl and the test sensors were at 350cm agl. All four sensors were powered continuously with 12V (i.e., not with SW12V) and aspirated. [Note added by Daphne 2022-02-08: sn T2820180 and sn T2820183 were originally reversed in this analysis because the serial number on the cable did not match the serial number on the sensor. I used the cable label originally to record what data came from which sensor. I have now fixed the serial numbers throughout the report.]
Experimental setup from 2021-11-04 to 2021-11-14 where 3 HMP155 sensors were compared with the tower HMP155. From 2021-11-14 to 2021-12-18, we compared the two HMP45s and the ATMOS14 against the tower reference sensor. The test sensors were mounted on the same post as before on the west side of the scaffolding so that they were about the same height as the test sensor. The ATMOS14 was not aspirated from 2021-11-14 to 2021-12-01 and it was aspirated from 2021-12-01 to 2021-12-18. You can see the unaspirated vs. aspirated comparison at the bottom of the report. Since there wasn't much of a difference, I used the whole ATMOS14 time series for the intercomparison. All sensors were powered continuously with 12V (i.e., not with SW12V). I don't have a photo from this second phase of the intercomparison, but it was very similar to the setup for the first phase.
Figure 1. Time series of air temperature. For the HMP155s, very tight fit overall although sn T2820180 starts drifting down on Nov 12 and is 0.5-0.7 degC lower than the other 3 sensors. After looking at the RH data, there was probably something wrong with sn T2820180 starting Nov. 12 because RH was substantially lower than reasonable (maybe a loose wire or too much humidity in the datalogger enclosure). In any case, I left the data in because it doesn't make much difference for the correction. For the second part of the comparison, the fit is still pretty good, except for the HMP45 sn U3030041, which pretty much failed immediately. It was inconsistent when it was deployed on the bouncer tower, so I wouldn't use data from this sensor.
Figure 2. Linear regression of the test HMPs against the reference sensor. All sensors had a tight fit with slopes close to 1 (0.95-1.00), offsets close to 0 (-0.36-0.55) and R2>=99%
Figure 3. Times series of air temperature with corrections applied. Didn't make much of a difference because the fits were already good.
Figure 4. Time series of RH from HMPs. With the HMP155s in the first part of the comparison, there was a very tight fit overall. I removed data from sn T2820180 after Nov. 12 because the values were too low. There was more noise in the second part of the comparison, with clear offsets in the HMP45 sensors.
Figure 5. Linear regression of test HMPs against the reference sensor. Again, a generally good fit with slopes close to 1 (0.97-1.05). Offsets for most sensors were close to 0 (-1.6-2.3). The offset for the ATMOS14 was larger at -6.3. R2 for the HMP155s were >=99%, R2 for the HMP45 sn T1250012was 98%, and R2 for the ATMOS14 was 96%. I did not plot the regression for sn U3030041 since the sensor is not reliable.
Figure 6. Times series of RH with corrections applied. Didn't make much of a difference because the fits were already good. The main difference was an offset of -6.3 applied for the ATMOS14.
Joe's comment about RH corrections: "Comparing and correcting RH has bothered me for a long time. There is a nice continuous signal until you have this discontinuity at 100%. If you have a sensor that maxes out at 95% and run a regression against a sensor that goes to 100% the regression never seems to fully compensate for the the offset at max RH. It seems like you need to first correct the offset at max RH and then stretch the signal to match with a regression."
ATMOS14: Aspirated vs. non-aspirated The ATMOS14 sensor was not aspirated for the first half of comparison. We added a computer fan for the second half of the comparison. We wanted to get both states for the intercomparison because this sensor was used both aspirated and non-aspirated earlier in the summer for the bouncer experiment. From these figures, we see that the unaspirated ("no fan") data is slightly noisier, but the linear regressions are very similar, so the unaspirated and aspirated data can be combined for the intercomparison.
Figure 7. Linear regression of air temperature compared to the tower HMP155. The unaspirated ("no fan") data is slightly noisier than the aspirated ("fan") data, but R2 for both is still 99% or higher. The slopes (0.97, 1.01) and offsets (-0.35, -0.59) are similar enough.
Figure 8. Linear regression of relative humidity compared to tower HMP155. Similarly to the air temperature data, the unaspirated ("no fan") data is slightly noisier than the aspirated ("fan") data, but the R2 for both are similar (96-97%). The slopes (1.04, 1.06) and offsets (-6.6, -6.8) are almost identical.
Further discussion on wind and aspiration Joe's comment: "Aspiration. I think the "noise" you see IS the non-aspirated data. At Bouldin it is windy most of the time thus aspirated. Only when there is little to no wind will the fan make a difference. Might be interesting to filter the points based on wind speed."
I plotted the ATMOS14 data against the tower HMP155 data and colored the points by wind speed.
First, a timeseries of the wind speed at BA during our intercomparison. Most of the time the wind was < 4m/s.
I plotted the ATMOS14 data against the tower HMP155 data and colored the points by wind speed.
First, a timeseries of the wind speed at BA during our intercomparison. Most of the time the wind was < 4m/s.
 The regression of the ATMOS14 (aspirated) against the tower HMP looks good regardless of wind speed. The circles are colored by wind speed, see color bar on the right for the legend.
 The regression of ATMOS14 (NOT aspirated) against the tower HMP is noisier, as we saw in the online report. The points that are further away from the regression line are darker colors, so wind speed < ~2m/s.
 To give us a little more resolution at low wind speeds, I filtered out wind speeds >4m/s. Again, we see the noisy points are mostly <2 m/s, but there are also non-noisy points that occur around the same wind speed as the noisy points.
 Joe's comments and figures: "Not as clear cut as I would have thought at first. However, I think it is relatively complicated. The reason for aspiration is because the sensor and the solar shield can affect the temperature of the air surrounding the sensor. Electrical heat from the sensor and radiative heating or cooling of the solar shield may change the temperature of the packet of air inside the shield. Or that packet of air may be shielded from rapid changes in the ambient air temperature. So more than just wind speed has to line up to cause a problem.
If I filter the outliers (about 40% of this data) the remaining non-aspirated regression looks about as good as the aspirated regression:
 The points that got filtered are mostly during periods where the air temperature is changing fast which makes sense to me. The orange lines in the plot below show where big differences occurred:
 Also, the aspiration rate needs to be specified as a volume per time not m/s. You need to move the air trapped inside the solar shield out and suck in some ambient air. This rate depends on the geometry of the solar shield and probably the thermal properties of the solar shield. For gradient work (Carlos) we need to be very careful with aspiration, but for our general tower work I don't think we need to throw out airT/RH when an aspiration fan has broken."
|
|||||||||||||||||||||||||||||||||||||||||||||||||||||||||||||||||||||||||
| |