Reports
Contents
| Title: | SW 4-way comparison - 2021 | |||||||||||||||||||||||||||||||||||||||||||||||||||||||
| Date: | 2021-02-25 - 2021-03-16 | |||||||||||||||||||||||||||||||||||||||||||||||||||||||
| Data File: | SWRadComp_30min_20210225.csv | |||||||||||||||||||||||||||||||||||||||||||||||||||||||
| Refers to: | 2420, 2466, 121038 | |||||||||||||||||||||||||||||||||||||||||||||||||||||||
|
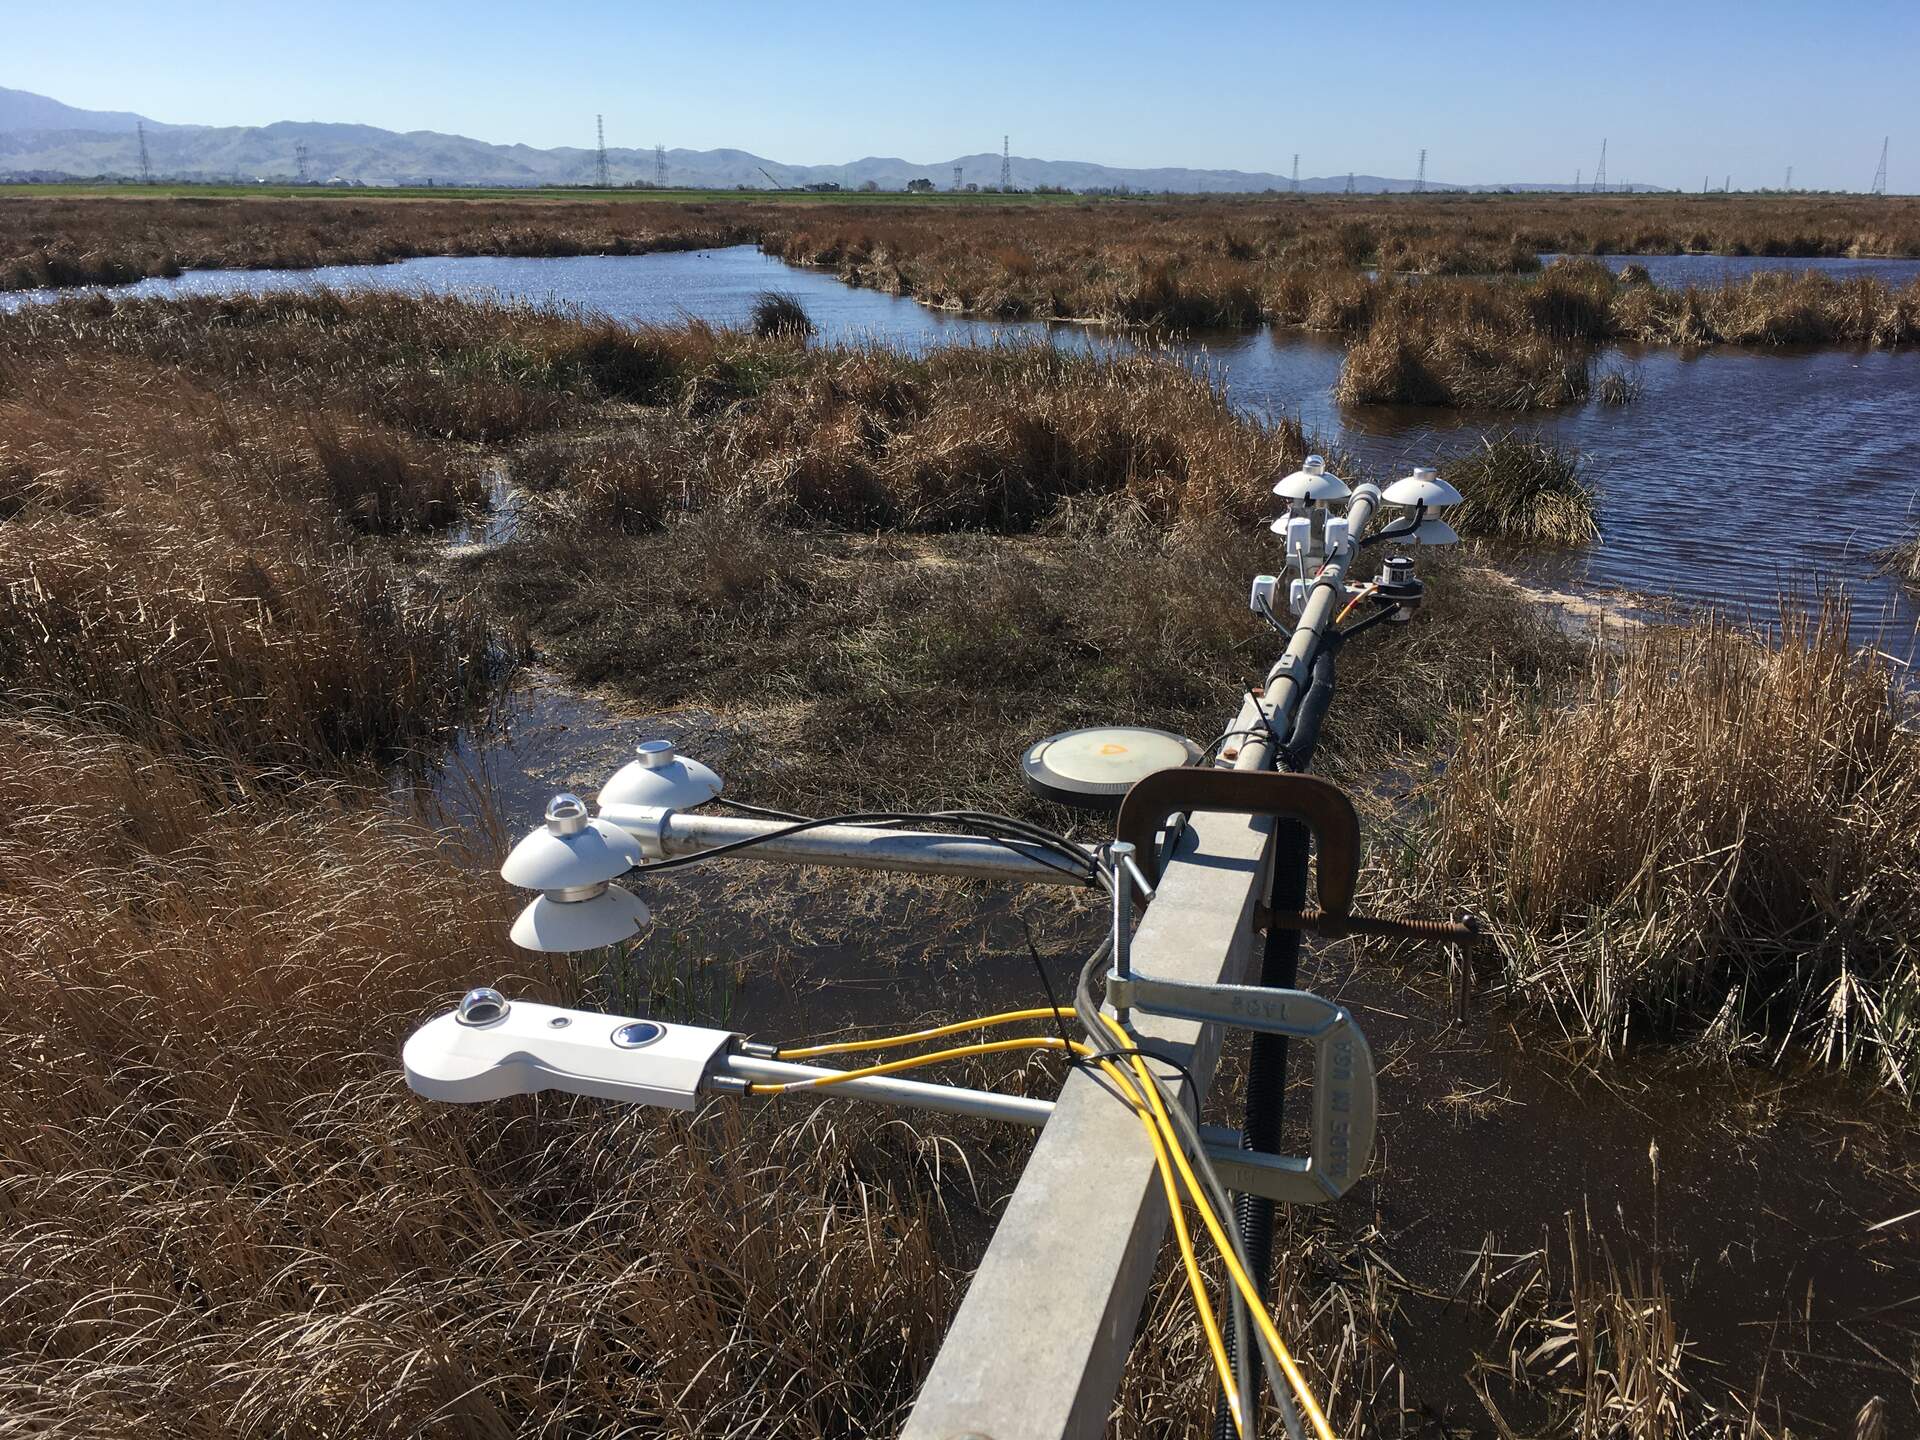
From 2021-02-26 to 2021-03-16, we installed two additional 4-way radiometers on the Sherman Wetland radiometer boom to do an intercomparison among the 3 4-way radiometers. sn 121038 - AMP standard sn 2420 - Previously on Bouldin Corn tower when it fell down in late January 2021. Joe repaired it and we are now testing it before installing the sensor on the new Hill Slough tower in march.This sensor was turned upside down on 2021-03-11 in the middle of the intercomparison so that the SWout and LWout sensors were facing upward. sn 2466 - Radiometer at Sherman wetland since initial setup in 2015. Â
  Figure 1. Time series of SWin data
Figure 2. Linear regression for SWin Figure 3. Time series of SWout data
Figure 4. Linear regression for SWout data Figure 5. Time series of LWin data Figure 6. Time series of LWout data  Figure 7. Time series of PRT temperature
Figure 8. Linear regression of PRT temperature Â
Figure 9. Linear regression solving for LWin coefficients | ||||||||||||||||||||||||||||||||||||||||||||||||||||||||


