
Reports
Contents
| Title: | WP Golden Set comparison 2020 | |||||||||||||||||||||||||||||||||||||||||||||||||||||||||||||||||||||||||||||||||||||||||||||||||||
| Date: | 2020-11-19 - 2021-01-03 | |||||||||||||||||||||||||||||||||||||||||||||||||||||||||||||||||||||||||||||||||||||||||||||||||||
| Data File: | GoldenSet_WP_20201119.csv | |||||||||||||||||||||||||||||||||||||||||||||||||||||||||||||||||||||||||||||||||||||||||||||||||||
| Refers to: | WP,060831,110336,110341,G4540025,R0360206,H0160076 | |||||||||||||||||||||||||||||||||||||||||||||||||||||||||||||||||||||||||||||||||||||||||||||||||||
|
In winter 2020-2021, we set up some reference sensors at WP tower for about 2 months.
We also took the opportunity to test 2 new sensors:
All these sensors were connected to a CR1000 sn 4190. Data was measured every 10 seconds and 30-minute averages were recorded. We compared these data from the reference and test sensors to the tower data. The tower sensors were connected to the met datalogger (CR1000 sn 47109). Data was measured every 10 seconds and 30-minute averages were recorded.Â
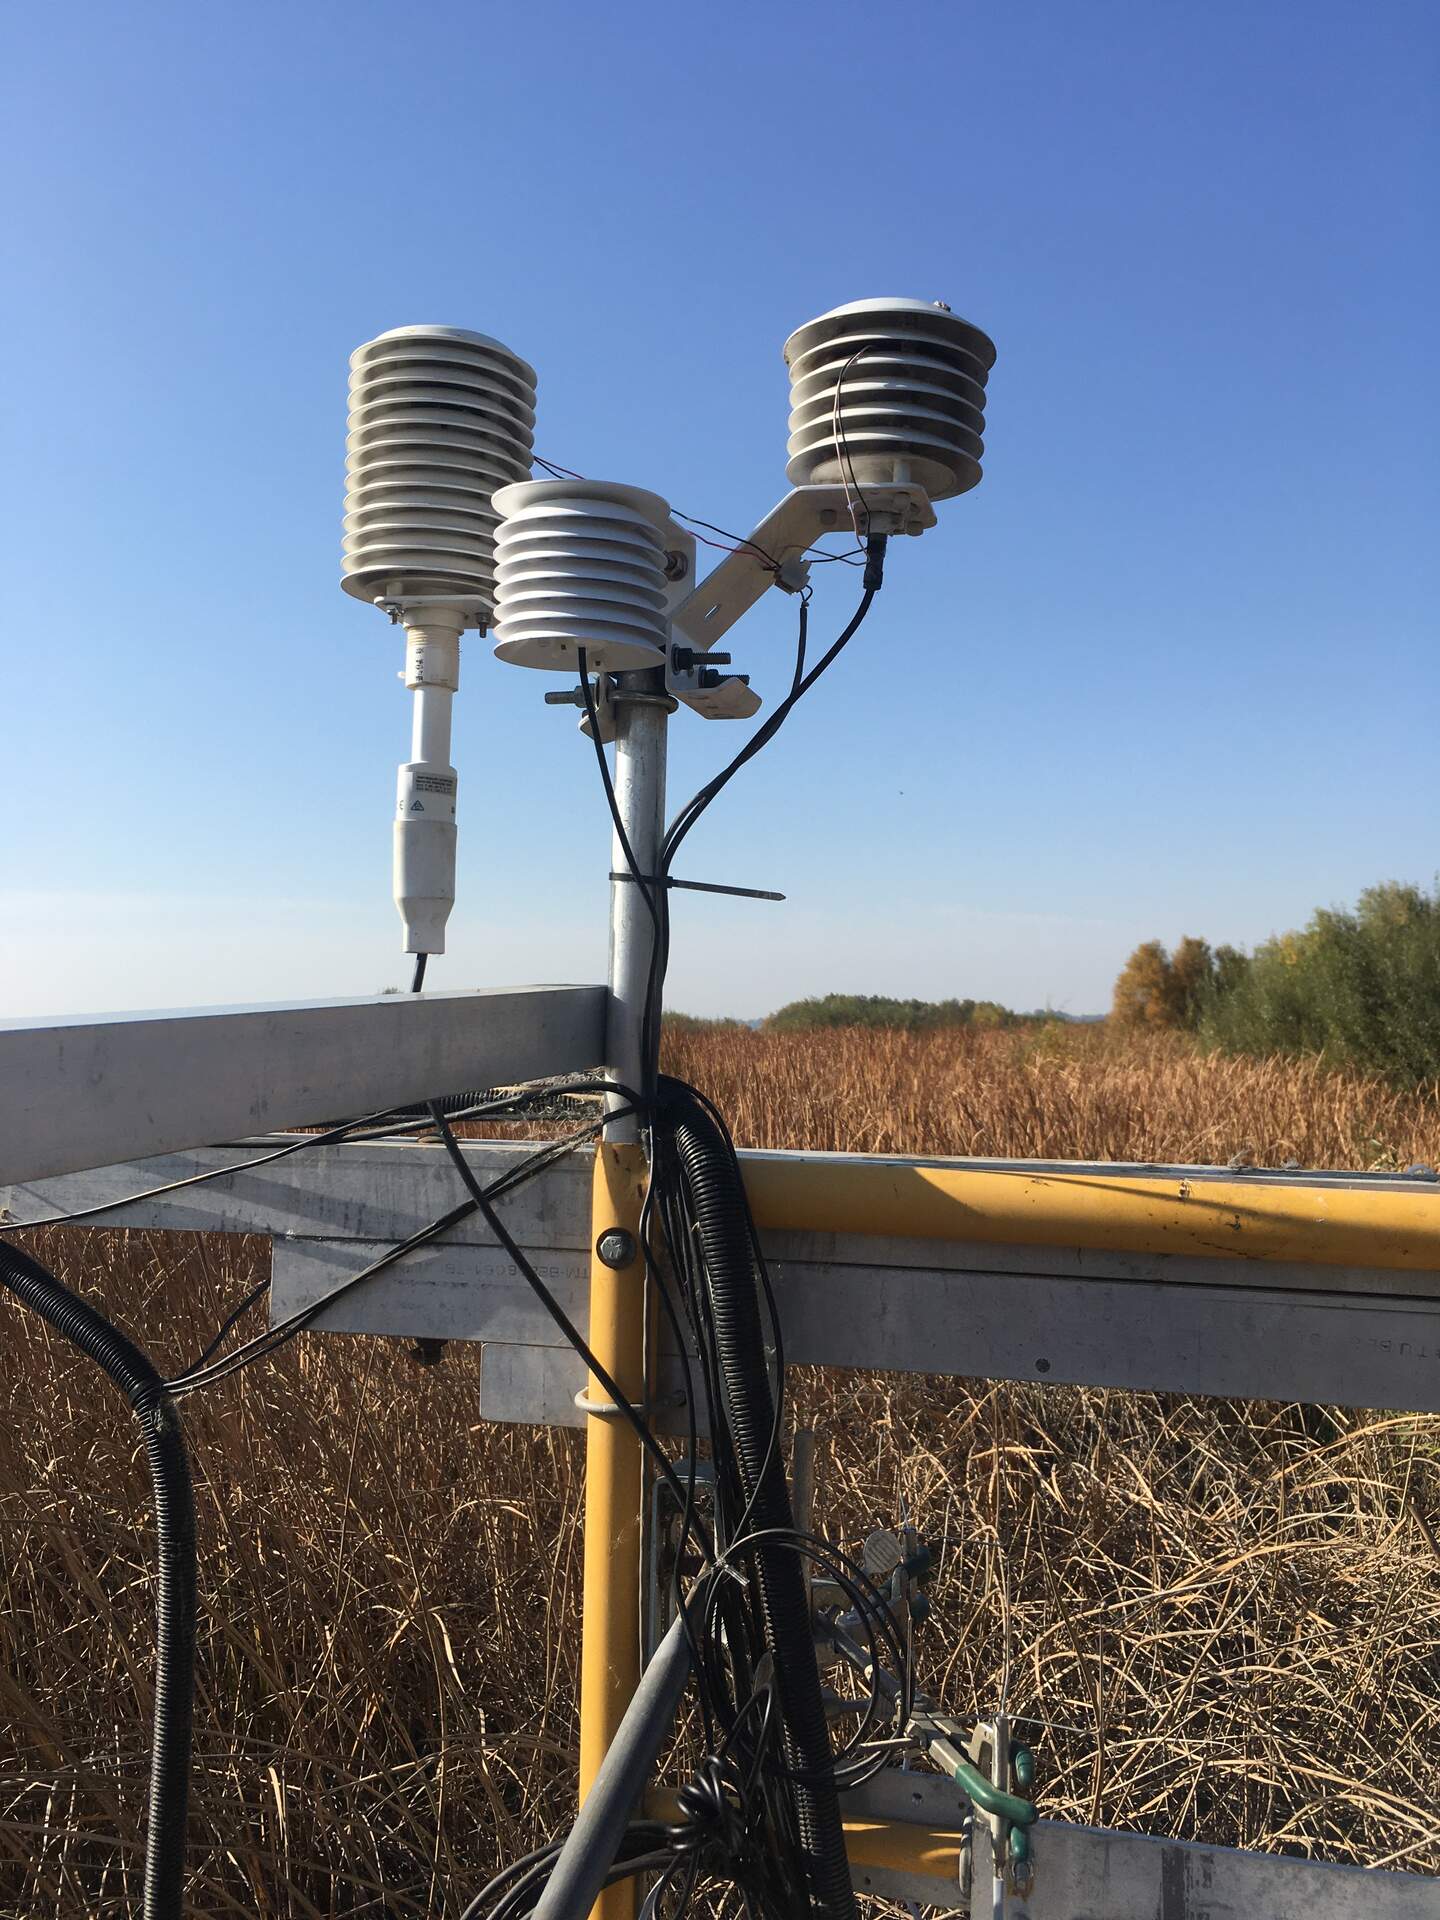
(L-R on post) HMP155, ATMOS14, WP tower HMP60. The HMP155 and WP tower HMP were ventilated. The ATMOS14 was not ventilated (our fan was too thick to fit in factory radiation shield). (Below scaffolding) Hard to see, but there are 2 multi-globe thermometers, one in each of the green clamps.
Â
Â
Air Temperature Figure 1. Time-series of air temperature from 3 sensors. The ATMOS14 sensor was added in early December. The tower HMP60 is consistently lower than the reference HMP115.
Figure 2. Regression between the reference sensors (HMP155) and 2 test sensors. The tower HMP60 has an offset of 2.3°C, so we should apply the field calibration to the WP data. I'll need to look into when the field calibration should begin.  Globe Thermometers Figure 14. 6 thermocouple readings from the 2 globe thermometer. GlobeTC_1 was NAN the whole time because it had a broken fine-wire thermocouple. The other thermocouple readings seem stable. Figure 15. Time-series of air temperature from globe thermometers and the reference sensor (HMP155).
Figure 16. Regression between globe thermometer and reference sensor  Relative Humidity Figure 3. Time-series of relative humidity from 3 sensors. The ATMOS14 sensor was added in early December. The HMP60 rails high at 97.7% and loses resolution when HMP155 RH>90%.
Figure 4. Regression between the reference sensor (HMP155) and 2 test sensors. WP tower RH > 97 were ignored in the regression because the sensor tops out at 97.6%. ATMOS14 RH > 99 were ignored in the regression because the sensors tops out at 100%. The tower HMP60 RH data would also be improved with the field calibration, but I'll need to check when the field calibration should begin. Since the calibration line for the tower HMP was curved, I tried to use 2 different calibration lines, trying different breakpoints such as RH=60% or RH=70%, but that got too complicated and the fit was not improved. Using a power equation (y-a^x+b) did not improve fit either. Â Figure 5.Trying out different calibration equations for the tower RH values. The tower sensor maxes out at RH=97.6% RH, but there's also much less little resolution above RH=90%. The two calibrations are similar enough, but one tops out at 95% and the other one tops out at 92%. Â Â Incoming PAR Figure 6. Time-series of incoming PAR. Fit looks pretty good although the reference PAR has higher daily maximums.
Figure 7. Regression between the reference sensor (AMP PAR) and the tower sensor. The new calibration coefficient is 4.34, almost 10% lower than the factory calibration coefficient. Â Reflected PAR Figure 8. Time-series of reflected PAR. Again, fit looks pretty good although reference PARout has daily higher maximums.
Figure 9. Regression between the reference sensor (AMP PAR) and the tower sensor. The new calibration coefficient is 4.07, about 13% lower than the factory calibration coefficient.  Atmospheric Pressure Figure 10. Time series of atmospheric pressure from both the tower PTB110 and the ATMOS14 sensor.
Figure 11. Regression between reference sensor (tower PTB110) and test sensor (ATMOS14). Lower resolution of ATMOS14 is apparent.  Vapor Pressure - calculated from AirT and RH. Not calibrating anything, just exploratory plotting Figure 12. Saturation vapor pressure (Esat) calculated using air temperature from the tower HMP and the HMP155. The tower HMP is farther from the HMP155 values. Esat=611.2 * e^(17.67*(17.502*T)/(T+240.97)) where T is temperature in Celsius  Figure 13. Vapor pressure of air (VPA) calculated using air temperature and RH from the tower HMP and the HMP155. VPA = RH * Esat  |
||||||||||||||||||||||||||||||||||||||||||||||||||||||||||||||||||||||||||||||||||||||||||||||||||||
| |