Reports
Contents
| Title: | SW AirT/RH comparison 2020 | |||||||||||||||||||||||||||||||
| Date: | 2020-09-10 - 2020-11-12 | |||||||||||||||||||||||||||||||
| Data File: | GoldenSet_SW_20200910.csv | |||||||||||||||||||||||||||||||
| Refers to: | sn W0730036, sn R0360206 | |||||||||||||||||||||||||||||||
|
In fall 2020, we set up some comparison sensors on the SW tower for about 2 months.
All these sensors were connected to a CR1000 sn 4190. Data was measured every 10 seconds and 30-minute averages were recorded. We compared these data to the tower AirT/RH data. The tower sensors were connected to the tower met datalogger. Data was measured every 10 seconds and 30-minute averages were recorded.
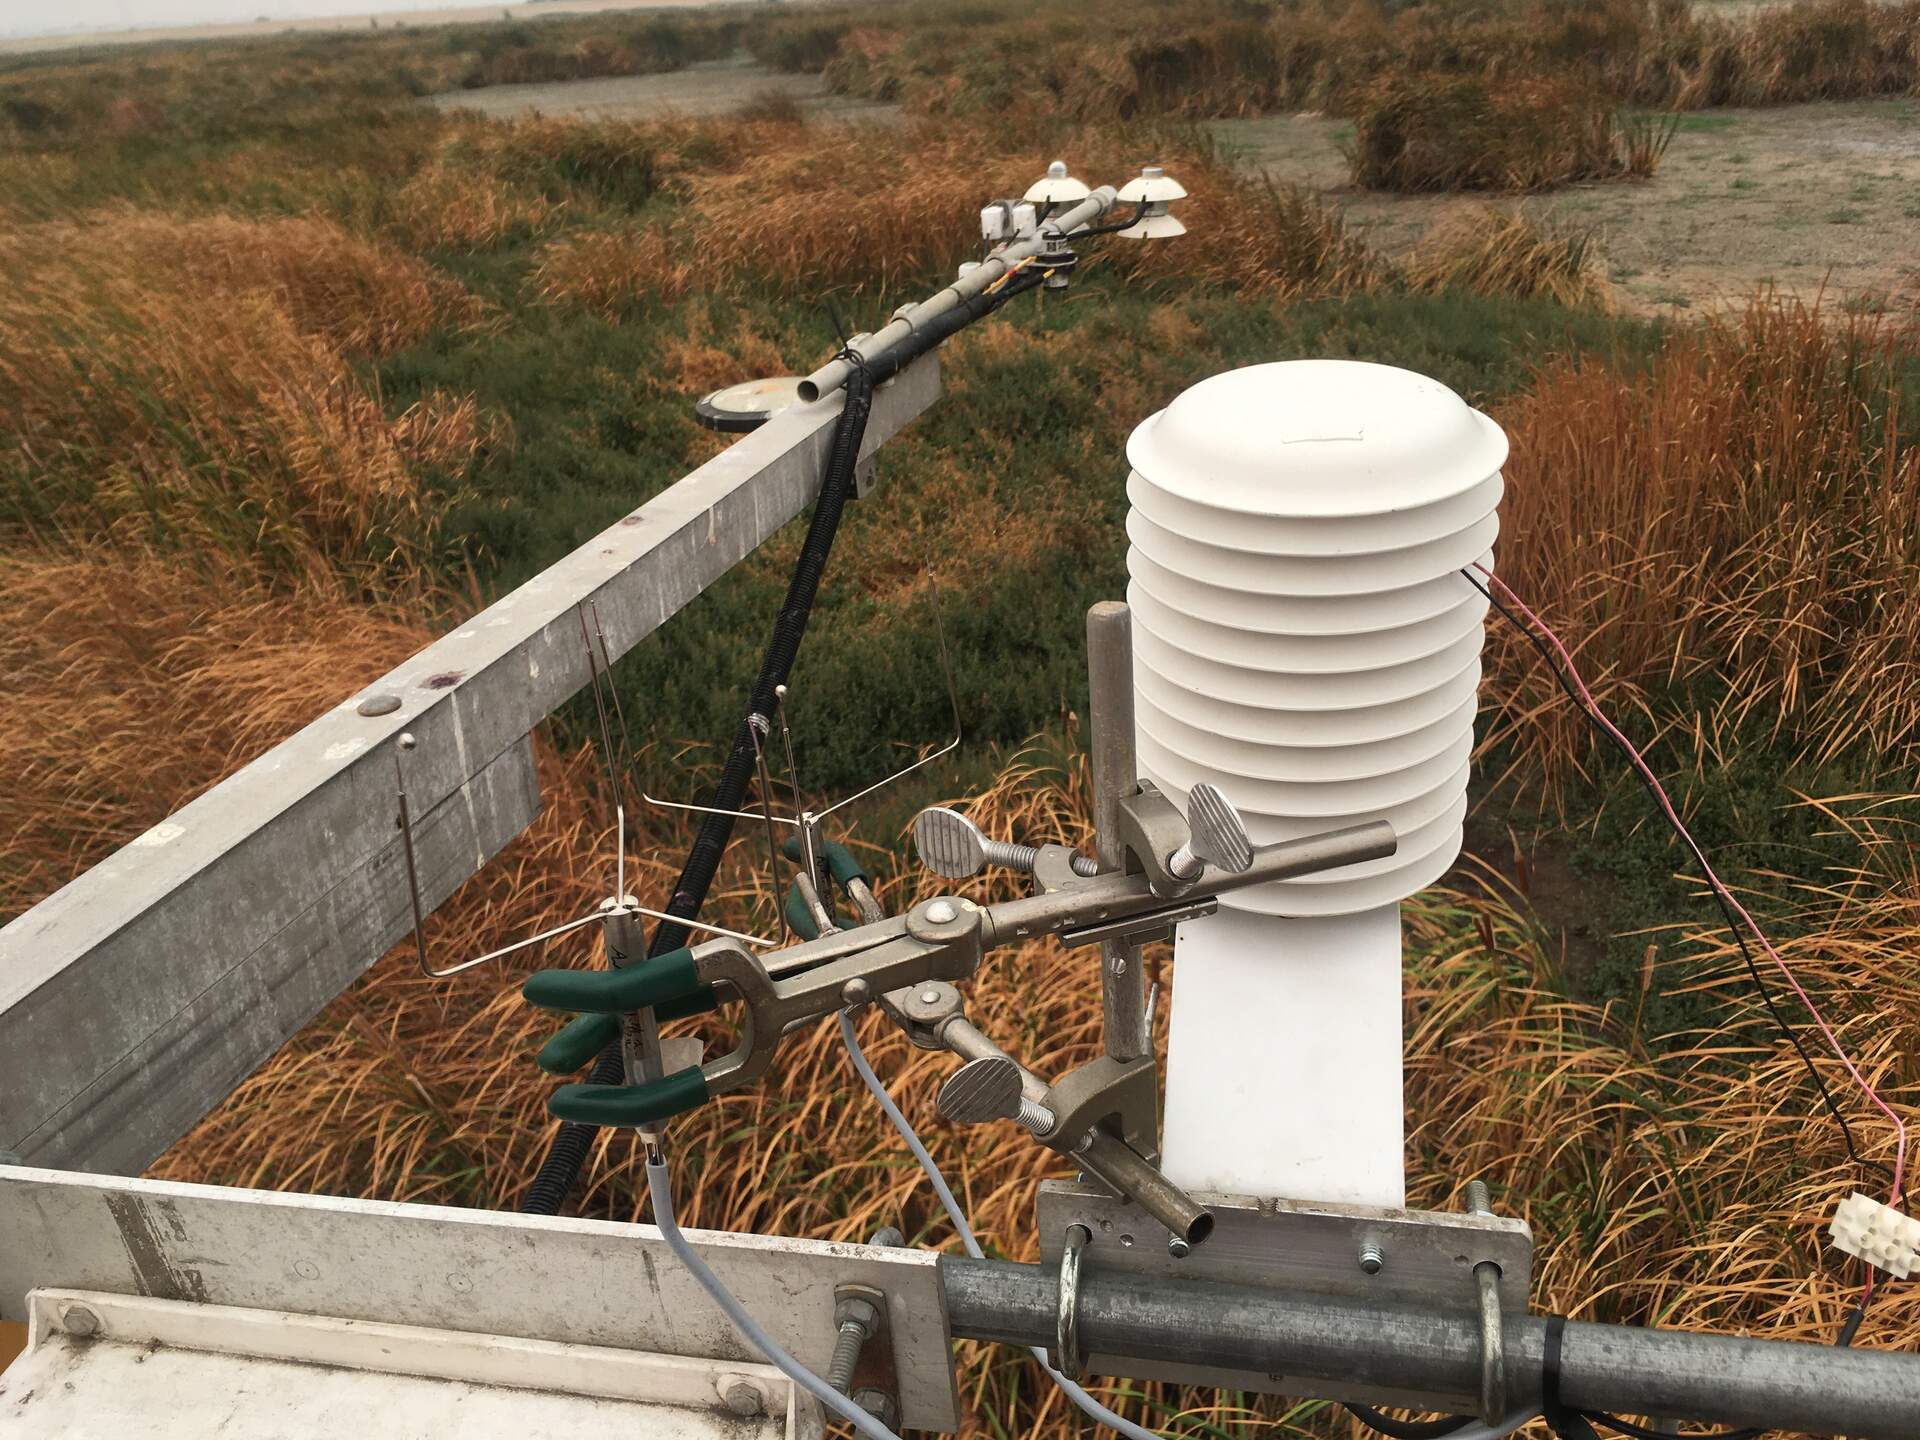
On the left in the green lab clamps are 2 globe thermometers. On right right is a new HMP155 sensor to act as our reference sensor. Â
Figure 1. Time-series of air temperature. Fit looks good except HMP155 has slightly lower daily minimums.
Figure 2. Linear regression of air temperature. Tight fit without much noise. Figure 3. Time-series of RH. Fit looks good except HMP155 has slightly higher daily minimums.
Figure 4. Linear regression of RH. There is a slightly different slope when RH<20%, but that doesn't happen frequently so I feel ok ignoring it. Figure 5. Time-series of calibrated RH. Seems like a reasonable calibration. |
||||||||||||||||||||||||||||||||
| |


