
Reports
Contents
| Title: | Rotating Shadow Band | ||||||
| Date: | 2015-07-01 | ||||||
| Data File: | TZ_RSB_day182.csv TZ_RSB_RawTo30min.csv |
||||||
| Refers to: | Diffuse PAR,TZ | ||||||
|
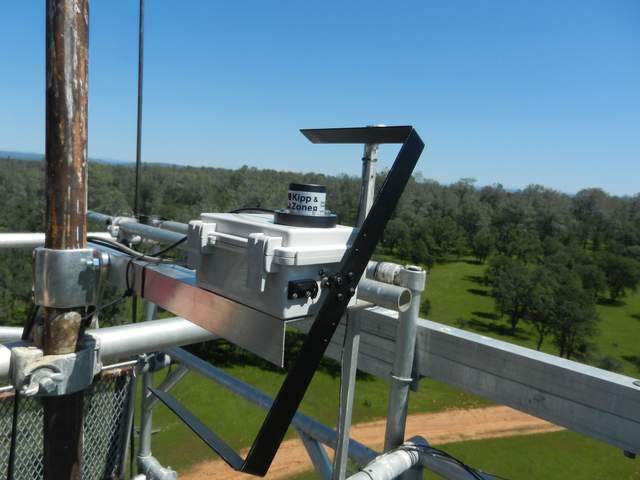
This report describes our homemade Rotating Shadow Band (RSB) diffuse PAR sensor. The sensors uses a Kipp & Zonen PAR sensor, a 0.5rpm DC motor and some magnetic proximity sensors.Â
The main parts are: motor - https://www.servocity.com/html/0_5_rpm_gear_motor.html The concept is to measure PAR quickly (2-10Hz) while a shadow band rotates slowly (0.5rpm) around the PAR sensor periodically casting a shadow on the PAR sensor. The magnetic proximity sensors detect when the shadow band is horizontal to delimit the time periods where one shadow passing has occurred and the minimum during that period will be the diffuse PAR. Advantages:
Disadvantages:
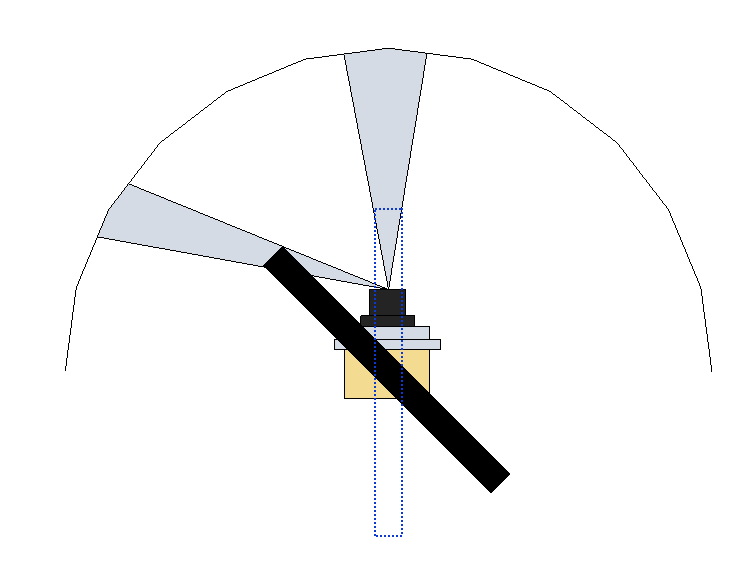
Diagram 1. Front View of the RSB diffuse PAR sensor. This diagrams shows the K&Z PAR sensor and the shadow band at a 45deg angle in black. A dotted blue rectangle shows the position of the shadow band when vertical. The black arc and light blue wedges show a projection of the shadow band to illustrate that different amounts of sky are blocked when the shadow band is in different positions. This ranges from about 4% at dawn and dusk to about 13% at midday.
Figure 1. A portion of the raw 10Hz data from the RSB during midday on a partially cloudy day. Each dip the the green line is when the RSB casted a shadow over the PAR sensor and the blue line shows the minima of these dips - the diffuse PAR. Figure 2. A zoomed in portion of the data in Figure 1 displaying the individual data points. Here you can see that there are 10-12 points during a shadow's passing and that the sampling rate could be reduced to about 2Hz as it is in later systems and still catch the minima. Figure 3. After the minima of each shadow passings have been found, these minima are averaged into 30min averages to be saved with the other 30min micromet data. |
|||||||
| |