Reports
Contents
| Title: | Vaira NDVI Data | ||||||||||||||||||||||||||||||||||||||||||||||||||||||||||
| Date: | 2020-12-07 | ||||||||||||||||||||||||||||||||||||||||||||||||||||||||||
| Data File: | VR_NDVI_all.csv | ||||||||||||||||||||||||||||||||||||||||||||||||||||||||||
| Refers to: | VR_met | ||||||||||||||||||||||||||||||||||||||||||||||||||||||||||
|
Vaira NDVI 2000-01-01 through 2020-12-31 NDVI has been measured for many years at Vaira using different methods including tower based sensors, manual measurements and satellites.Â
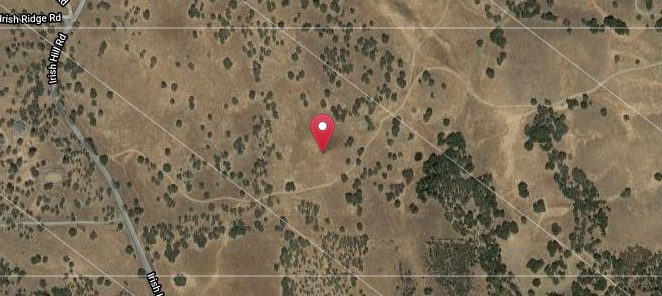
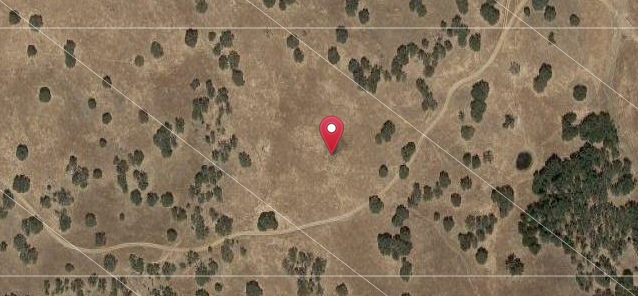
MODIS_500m, MODIS_250m: MODIS satellite data is available from 2000-02-18 to present. Here we have two products: 16day 250m NDVI and NDVI calculated from 8day 500m Red and NIR reflectance. This data is available through Ameriflux and ORNL DAAC. https://modis.ornl.gov/cgi-bin/sites/site/?network=AMERIFLUX&network_siteid=US-Var&product=MOD13Q1 The MODIS 500m pixel:
The MODIS 250m pixel:
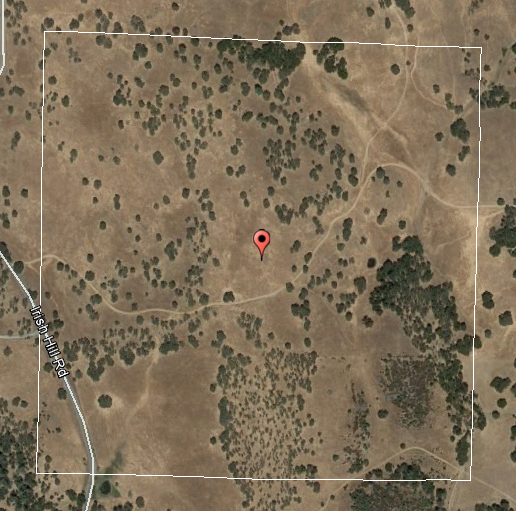
PAR-SW: Broadband NDVI can be calculated from PAR and SW-PAR (Huemmrich et al., 1999). Here we are converting PAR to W/m2 with a conversion factor of 4.6 (µmol m-2 s-1) / (W m-2) LED: Our homebuilt LED sensor has been on the tower from 2004-07-24 to present and is described here: Ryu Y, Baldocchi DD, Verfaillie J, Ma S, Falk M, Ruiz-Mercado I, Hehn T, Sonnentag O (2010) Testing the performance of a novel spectral reflectance sensor, built with light emitting diodes (LEDs), to monitor ecosystem metabolism, structure and function. Agricultural and Forest Meteorology. 150, 1597-1606. Spec: Handheld spectral measurements are made at most field visits with an Ocean Optics USB2000-VIS-NIR (and most recently the Jaz model) sensor. NDVI is calculated from these spectra using a Red band of 620-670nm and a NIR band of 841-876nm. The LED sensor was calibrated with this spectrometer so these measurements should match at least at the beginning. PL_Center, PL_All: Recently we received R, G, B and NIR imagery at 3m pixel resolution from Planet Labs. This data has been corrected using Landsat and Sentinel data and gap fill to generate daily images. An area 243x243 pixels was pulled to match the tower's foot print. Both the average of this total area and the NDVI of the center pixel are presented here.
SRS: We also had a Decagon (now METER) SRS NDVI sensor on the tower for a few months 2017-09-07 through 2018-02-07 and now again since 2019-02-20. The information about the previous inter-comparison can be found in the report here: https://nature.berkeley.edu/biometlab/bmetdata/rtreport.php?screen=view&id=5 Arable: And finally, we have had a number of Arable Mark units on the tower since 2019-05-01. The data here is from a first generation Mark I, a prototype Mark II and finally a production Mark II. For all of the Tower based data (LED, PAR-SW, SRS, Arable) an average of 30min midday values (11:00 - 13:00) were used to calculated daily NDVI. All of this data is presented in the first figure.
Â
Figure 4. Scatter  |
|||||||||||||||||||||||||||||||||||||||||||||||||||||||||||
| |


