Field Notes
<--2006-01-20 00:00:00 |
2006-02-09 00:00:00-->
Phenocam link:
Searching...Tonzi: 2006-01-24 11:35:00 (DOY 24)
Author: Siyan Ma
Others:
When: Date: 1/24/2006, Day: 24,
Watch Time: 11:35
Where: Tonzi/Vaira Ranch
Who: Siyan
Weather:
clear, hot sunshine, breeze
Phenology:
green grass, still see brown grass litter. Looks like more tiny grass came
out.
Summary
- check and download data at
Tower, Floor, and Vaira
- swap Li7500 at Tower, Floor,
and Vaira
- something still wrong with
the CR23X at Vaira, no Met data in the computer, “Busy with COM”.
- Ted let me check the computer
time and datalogger. They matched
to each other pretty well.
- At Tower, clean up bird crap
on the solar radiation sensor.
Since bird flu still makes threats, I recommend using gloves to
deal with bird craps. Can we order
some plastic laboratory gloves
- soil CO2 profile: CO2
concentration at Channel 14 was -99999.
- Measurements: soil moisture, dendrometer,
spectrometer
- samples: grass LAI, samples
MIBA
Vaira_Grass
Site
- Fence and gate power: >12 v.
- Panel and Batteries: 13.2
v; 6.8 amps; 2.6
amps.
- Reading from Gillsonic screen
before downloading data. (The value
of H2O and CO2 should bein the range of 0 – 5 v.)
Time
|
12:06:37
|
Path/File name
|
D:\Data\V06_024.flx
D:\Data\VR0241200.raw
|
|
mean
|
std
|
|
mean
|
std
|
w
|
-0.21
|
0.184
|
Ts
|
16.879
|
1.046
|
u
|
-1.16
|
0.539
|
H2O
|
2.136
|
0.092
|
v
|
-1.69
|
0.945
|
CO2
|
2.014
|
0.041
|
- downloading data, but no Met data in the computer
- swaping Li-7500 Analyzer. (Remove SN# 73 ; install SN# 42 ): readings were less than
1. double check the connections,
and readings went back to normal, around 1.9.
- check the fans of air temp.
and relative humidity sensors at Vaira. Good.
- Connection between computer
and CR23X was successful once, and then “Error” occurred. Check computer time 01/24/06 12:26:44, datalogger time 01/24/06 12:26:32. So, 12 sec difference.
- Check CR23X with two multiplexers,
showing “Busy with Com”
- Check levels of Radiation
sensors, clear up surfaces.
- Closed gate and set up fence.
- spectrometer measurement
taken
- grass LAI sample taken
- soil moisture measured
Tonzi_Tower Site
- Fence and gate power: >12 v.
- Panel and Batteries: 13.4 v; 0.0 amps; 3.5 amps.
- Reading from Gillsonic screen
before downloading data. (The value
of H2O and CO2 should be in the range of 0 – 5 v.)
Time
|
13:36:50
|
Path/File name
|
D:\Data\T06_024.flx
D:\Data\TW060241300.raw
|
|
mean
|
std
|
|
mean
|
std
|
w
|
0.33
|
0.523
|
Ts
|
18.18
|
0.472
|
u
|
2.06
|
1.507
|
H2O
|
1.796
|
0.077
|
v
|
0.48
|
0.508
|
CO2
|
1.857
|
0.009
|
- Reading from Gillsonic screen
after downloading data or swaping Li-7500 Analyzer. (Remove SN# 65 ; install SN# 418 )
- check the fans of air temp.
and relative humidity sensors on the tower and the floor. Good!
- Check calibration cylinders;
CO 2 2100 psig; flow 8
psi.
N 2 250
psig; flow 10 psi.
May Nitrogen tank be
almost empty
Is the pump running Yes.
- clean up bird crap on the
solar radiation sensor. Since bird flu still makes threats, I
recommend using gloves to deal with bird craps. Can we order some plastic laboratory
gloves
- close gate and set up fence.
Toniz_Floor
Site
- Fence and gate power: >12 v.
- Panel and Batteries: 13.3 v; 5.2 amps; 2.0 amps.
- Reading from Gillsonic screen
before downloading data. (The value
of H2O and CO2 should be in the range of 0 – 5 v.)
Time
|
14:57:59
|
Path/File name
|
D:\Data\F06_024.flx
D:\Data\FL0241200.raw
|
|
mean
|
std
|
|
mean
|
std
|
w
|
0.13
|
0.234
|
Ts
|
20.3
|
0.314
|
u
|
0.23
|
0.366
|
H2O
|
2.014
|
0.016
|
v
|
1.07
|
0.481
|
CO2
|
2.093
|
0.00
|
- downloading data
- swaping Li-7500
Analyzer. (Remove SN# 41 ; install SN# 35 )
- Check MD-9 system connections
datalogger
|
Connect
Yes/No
|
Computer time
|
Datalogger time
|
CR23X3 – floor-Met
|
Y
|
15:10:56
|
15:10:55
|
CR23X5 – soil CO2
profile
|
Y
|
15:10:01
|
15:09:59
|
CR23X6 – tower-Met
|
Y
|
15:08:46
|
15:08:45
|
CR10X2 – floor-Met
|
Y
|
15:11:20
|
15:11:18
|
CR10X4 – sap-flow
|
N
|
-
|
-
|
CR10X7 – CO2 profile
|
N
|
-
|
-
|
CR10X8 – wind profile
|
Y
|
15:09:34
|
15:09:32
|
- Soil CO2 profile
Reading
from datalogger
Panel
temp
|
20.780
|
|
|
Battery
voltage
|
13.673
|
|
|
CO2E_1
|
3397.1
|
TCE_1
|
14.15
|
CO2W_1
|
1108.8
|
TCW_1
|
18.447
|
CO2E_2
|
1137.1
|
TCE_2
|
14.49
|
CO2W_2
|
1651.4
|
TCW_2
|
15.80
|
CO2E_3
|
1476.3
|
TCE_3
|
12.15
|
CO2W_3
|
4745.5
|
TCW_3
|
13.14
|
CO2E_4
|
3010.8
|
TCE_4
|
9.47
|
CO2W_4
|
-99999
|
TCW_4
|
13.81
|
Reading
from panels of analyzers
depth
|
Open
|
order
|
depth
|
Tree
|
order
|
2cm
(1%)
|
4620
|
1
|
2cm
(1%)
|
2280
|
1
|
4cm
|
2280
|
2
|
4cm
|
1.11%
|
4
|
8cm
|
2980
|
3
|
8cm
|
3550
|
2
|
16cm
|
6030
|
4
|
16cm
|
1.97%
|
3
|
- Close gate and set up fence.
Tonzi
|
|
|
|
Dendrometer
|
|
|
|
|
|
|
Date
|
Day
|
Tag #
|
Reading (cm)
|
1/24/2006
|
24
|
71
|
22.7
|
|
|
72
|
23.3
|
|
|
77
|
Broken
|
|
|
78
|
Broken
|
|
|
79
|
22.9
|
|
|
245
|
20.3
|
|
|
248
|
24.2
|
|
|
250
|
21.7
|
|
|
255
|
22.9
|
|
|
252
|
missing
|
|
|
102
|
Broken
|
tonzi
|
7931AFE
|
402165
|
574B4B
|
402FF3
|
574632
|
7A432E
|
7A3C6E
|
7A3B40
|
7A4AAA
|
D024
|
|
|
|
|
|
|
|
|
|
24-Jan-06
|
SM
|
|
|
|
|
|
|
|
|
0-15
|
41.4
|
35.2
|
42.9
|
20.2
|
38.0
|
34.2
|
24.3
|
24.0
|
22.7
|
15-30
|
37.8
|
32.5
|
38.3
|
39.3
|
38.1
|
26.9
|
28.3
|
32.6
|
20.4
|
30-45
|
38.3
|
38.4
|
42.7
|
37.2
|
43.4
|
28.8
|
31.5
|
34.3
|
34.1
|
45-60
|
39.8
|
40.1
|
50.2
|
46.9
|
42.1
|
31.4
|
43.6
|
43.6
|
31.5
|
|
|
|
|
|
|
|
|
|
|
|
A6D882B
|
A3D04E8
|
A6D72F5
|
|
|
|
|
|
|
|
|
|
|
|
|
|
|
|
|
0-15
|
33.5
|
171.9
|
21.0
|
|
|
|
|
|
|
15-30
|
27.1
|
29.3
|
32.5
|
|
|
|
|
|
|
30-45
|
35.4
|
35.3
|
34.4
|
|
|
|
|
|
|
45-60
|
41.9
|
47.3
|
44.8
|
|
|
|
|
|
|
|
|
|
|
|
|
|
|
|
|
vaira
|
57318a
|
7933dee
|
|
|
|
|
|
|
|
0-15
|
20.6
|
27.4
|
|
|
|
|
|
|
|
15-30
|
27.3
|
30.6
|
|
|
|
|
|
|
|
30-45
|
29.9
|
30.0
|
|
|
|
|
|
|
|
45-60
|
31.5
|
35.4
|
|
|
|
|
|
|
|
Sample sheet for MIBA
Sample vial
|
What
|
MIBA-US-01._-
|
Leave 1
|
MIBA-US-01.__-
|
Leave 2
|
MIBA-US-01. ___143_
|
Grass 1
|
MIBA-US-01. __144
|
Grass 2
|
MIBA-US-01. _145
|
Surface Litter
|
MIBA-US-01. _146_
|
Soil in 10 cm
|
MIBA-US-01. _147__
|
Stem 1
|
MIBA-US-01. _148_
|
Stem 2
|
|
Field Data
No tank data
No TZ Well data found
No TZ Moisture Point data found
No VR Moisture Point data found
No TZ grass heigth found
No VR grass heigth found
No TZ Tree DBH found
No water potential data found
No TZ Grass Biomass data found
No TZ OakLeaves Biomass data found
No TZ PineNeedles Biomass data found
0 photos found
16 sets found
No data found for TZ_Fenergy.
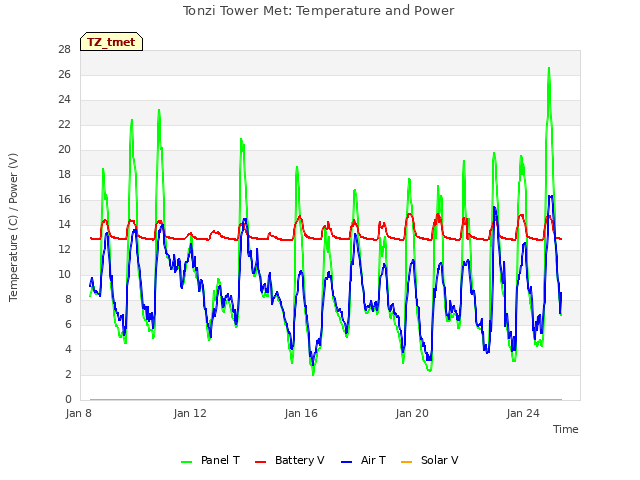
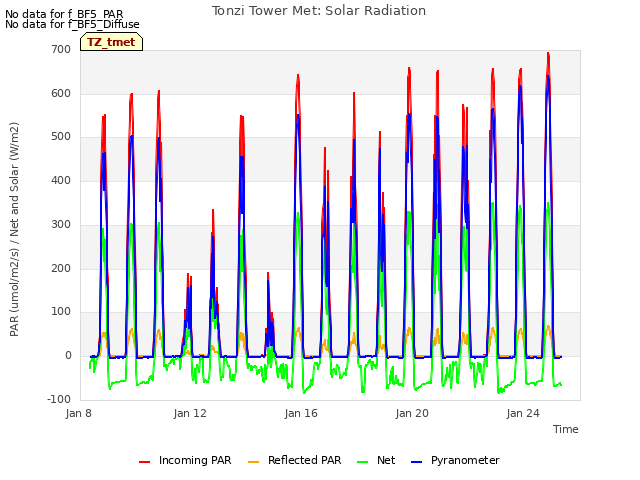
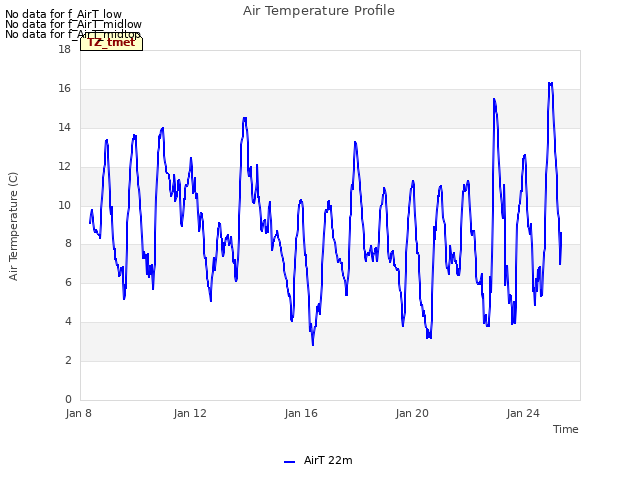
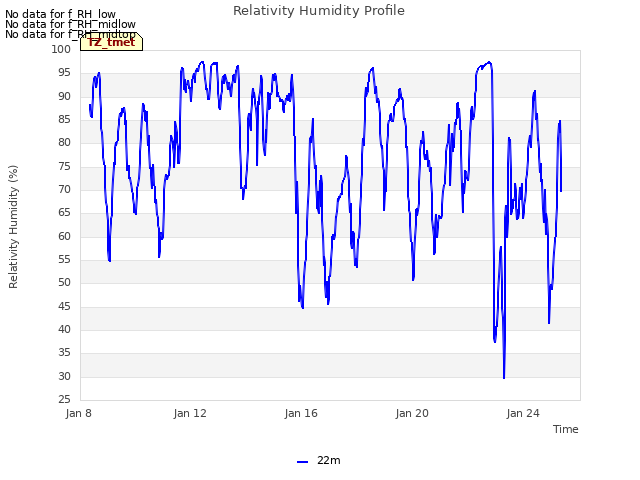
11 TZ_tmet graphs found


No data found for TZ_soilco2.
Can't check TZ_mixed
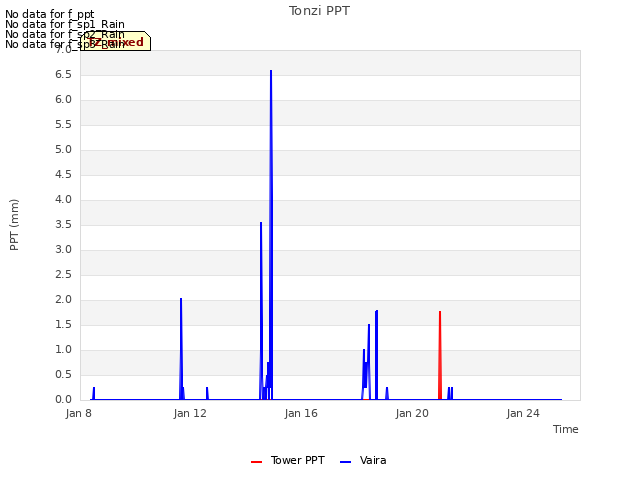
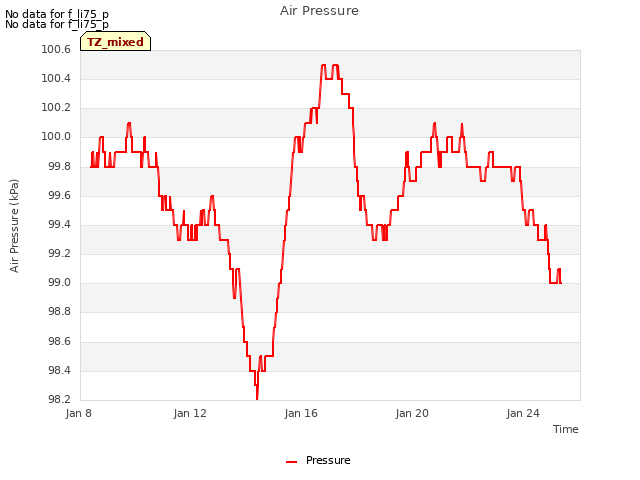
3 TZ_mixed graphs found

No data found for TZ_fflux.
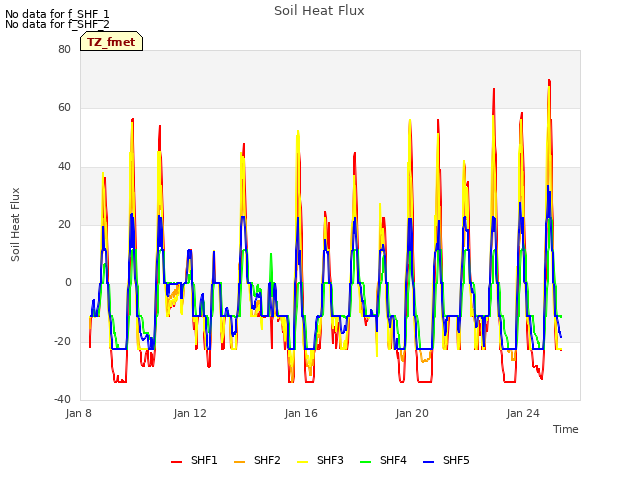
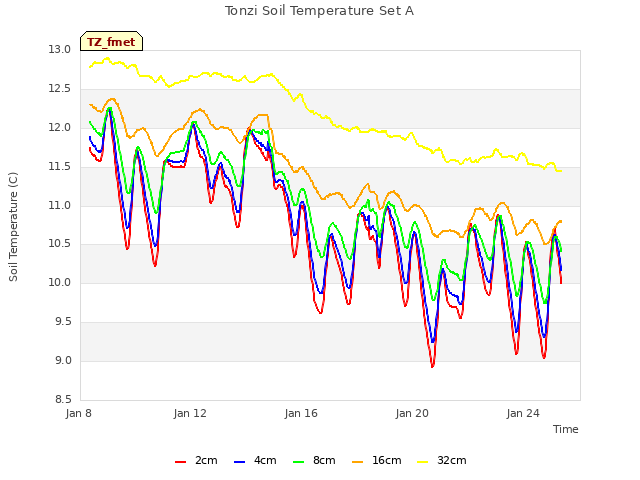
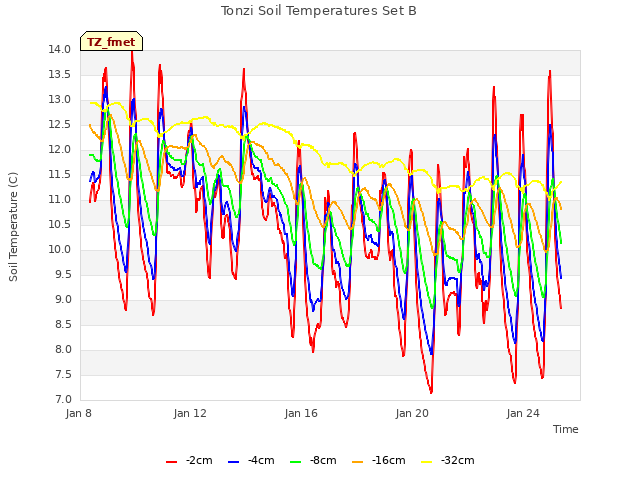
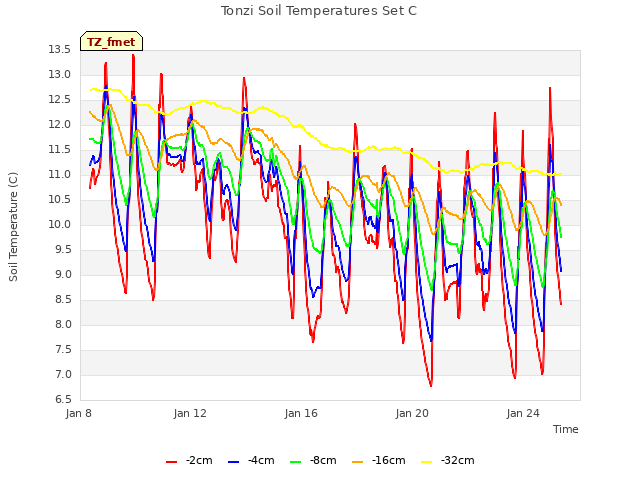
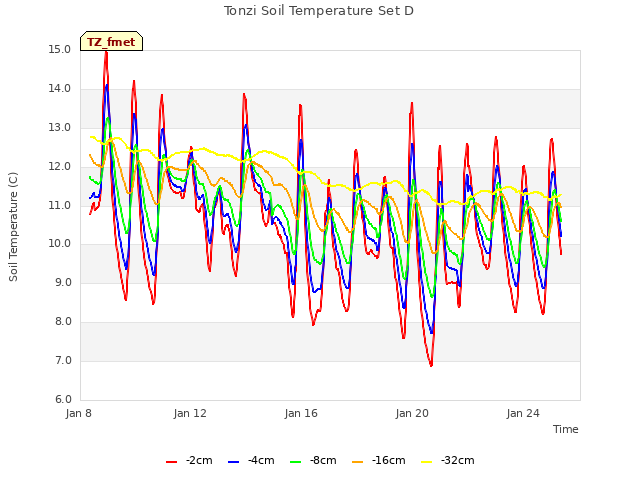
8 TZ_fmet graphs found


No data found for TZ_tram.
No data found for TZ_co2prof.
No data found for TZ_irt.
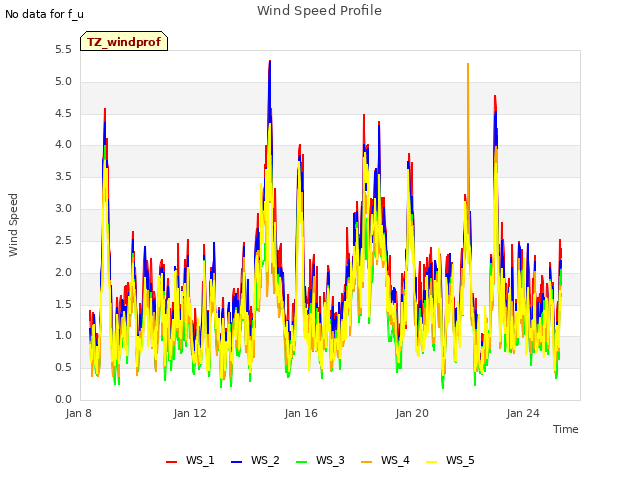
1 TZ_windprof graphs found
No data found for TZ_tflux.
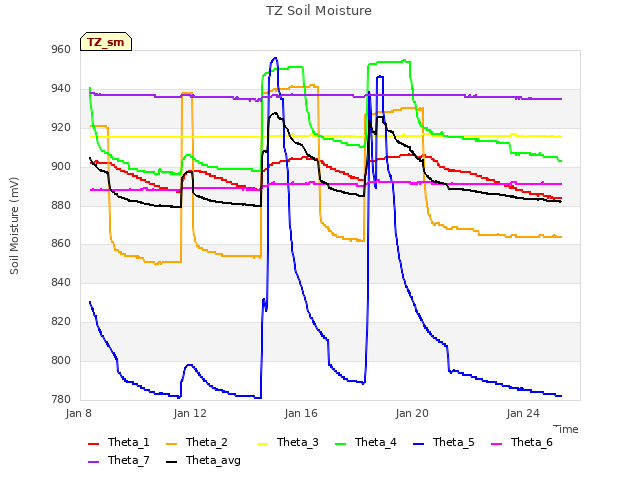
2 TZ_sm graphs found

Can't check TZ_met
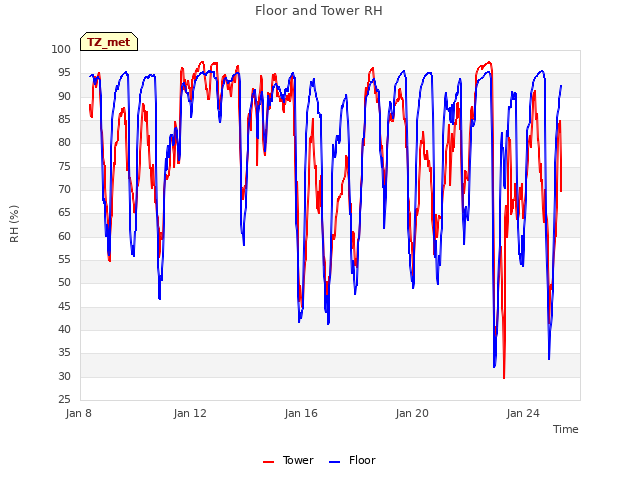
1 TZ_met graphs found
Can't check TZVR_mixed
No data found for TZ_osu.
No data found for TZ_fd.
Tonzi Z-cam data


